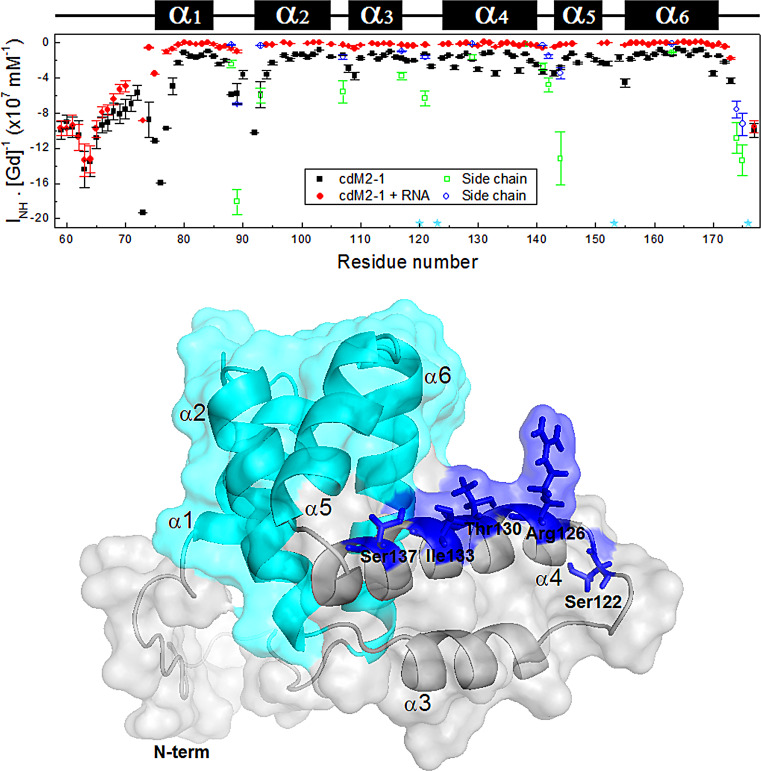
FIG 4.
Solvent paramagnetic relaxation enhancement for free and RNA-bound cdM2-1. (Top) Solvent exposure (INH · [Gd]−1) of each backbone NH amide of the protein (black squares) and its complex with RNA (red circles) measured as a function of the residue number. The cdM2-1 concentration was 350 μM, and the RNA concentration was 115 μM, the temperature was 25°C, and the NMR spectrometer was 14.1 T (1H frequency, 600 MHz). The green squares and blue circles denote the solvent exposure for the side chains of the Asn and Gln residues, respectively. The cyan stars indicate the proline residues (Pro120, Pro123, Pro153, and Pro176). The secondary structures along the sequence are indicated at the top. (Bottom) Structural representation of hRSV cdM2-1, shown as a cartoon with a transparent surface. The residues Ser122, Arg126, Thr130, Ile133, and Ser137 in the α4 helix (blue sticks) exhibit an i + 4 pattern of solvent exposure corresponding to a nearly α-helix turn. The cyan color denotes the α1-α2-α5-α6 helix bundle.

