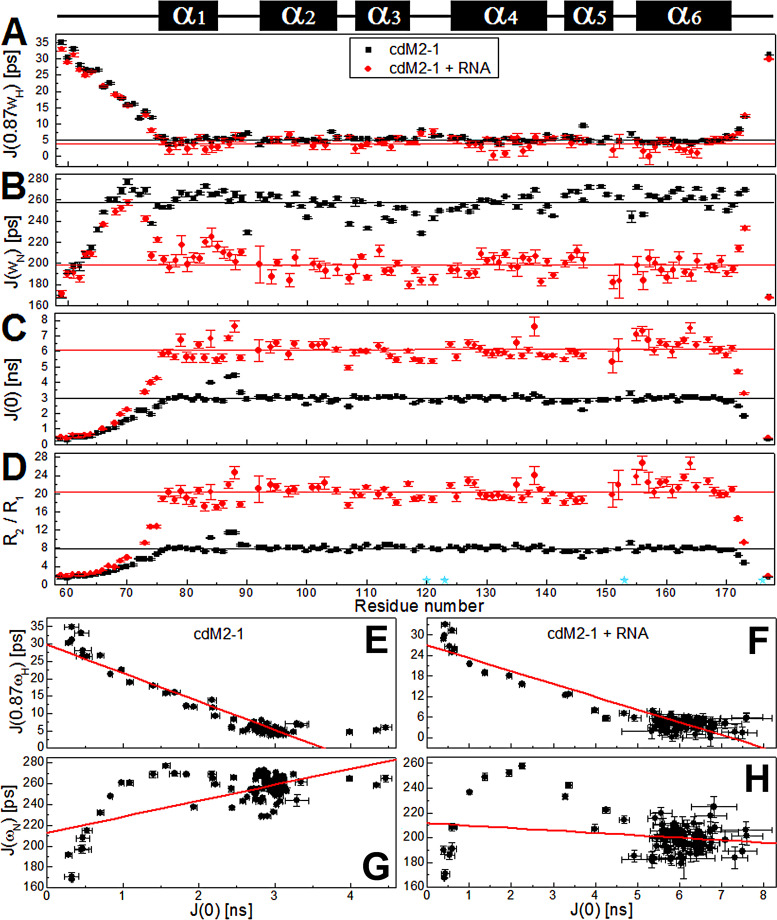
FIG 7.
15N nuclear spin relaxation data for the free and RNA-bound cdM2-1 backbone amide by NMR on a picosecond-to-nanosecond timescale. (A to C) Reduced spectral density functions (A), (B), and (C) of cdM2-1 and its complex with RNA, which were calculated from the 15N R1, R2, and hetNOE relaxation data. (D) R2/R1 ratio calculated from relaxation rates R1 and R2. The black and red lines denote the average values of , , and for free and RNA-bound cdM2-1, respectively. To determine the average values, those corresponding to the N- and C-terminal residues were excluded. The cyan stars indicate the proline residues (Pro120, Pro123, Pro153, and Pro176). The secondary structures along the sequence are indicated at the top. (E to H) Plots of the correlations of and and of and for free cdM2-1 (E and G) and RNA-bound cdM2-1 (F and H). The cdM2-1 concentration was 350 μM, the RNA concentration was 115 μM, the temperature was 25°C, and the NMR spectrometer was 14.1 T (1H frequency, 600 MHz). The red lines denote the linear fitting adjustment.

