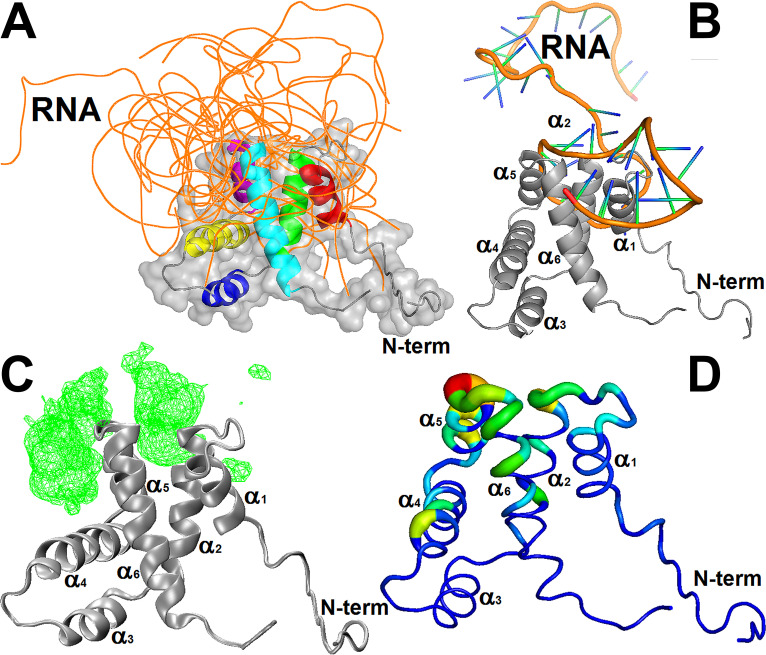
FIG 9.
Analysis of the molecular dockings of the structural models of the cdM2-1/RNA complex. (A) Structural models of the cdM2-1/RNA complex calculated by the 3dRPC web server. The backbone of the protein (different colors) and the 10 nucleic acids (orange) are presented as a cartoon and ribbons, respectively. The protein is also shown as a surface representation, and its helices are highlighted using different colors (red, α1; green, α2; yellow, α3; blue, α4; purple α5; cyan, α6). (B) Structural model of the cdM2-1/RNA complex, which exemplified the preferential binding of the protein (gray cartoon) close to secondary structural regions of the RNA molecules (shown as a cartoon; orange, backbone; green/blue, nucleosides). (C) Mass density map (green mesh with an isovalue of 0.5) of 10 RNA molecules bound to the protein (gray cartoon) generated by the VMD program using the VolMap tool. (D) Absolute accessible surface area change (ΔASA) of cdM2-1 (as a colored worm) bound to the nucleic acids. The thickness and colors represent the degree of ΔASA, with the strongly and weakly accessible residues shown in blue (thin) and red (thick), respectively. The structural representations were made with the PyMOL and VMD programs.

