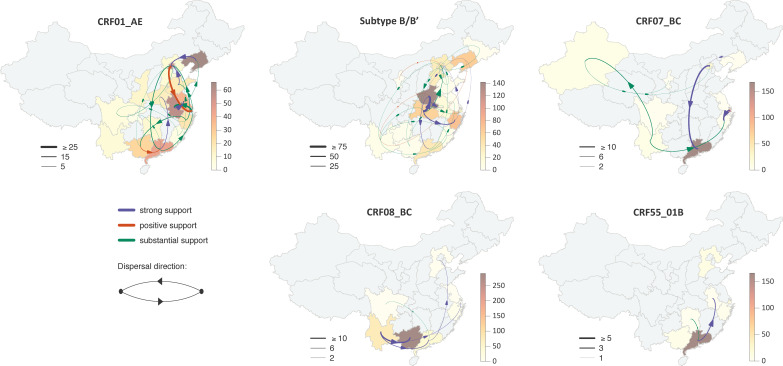
FIG 1.
Migration events between provinces in China. The thickness of the arrows corresponds to the average number of inferred migration events, their curvature indicates the migration direction, and their colors reflect the support for each link (green, orange, and purple for 3 ≤ BFadj < 10 [substantial], 10 ≤ BFadj < 20 [positive], and BFadj ≥ 20 [strong], respectively). Provinces are colored according to the number of sequences included in the clusters for each HIV type. The underlying map is from the Database of Global Administrative Areas (GADM; https://gadm.org).

