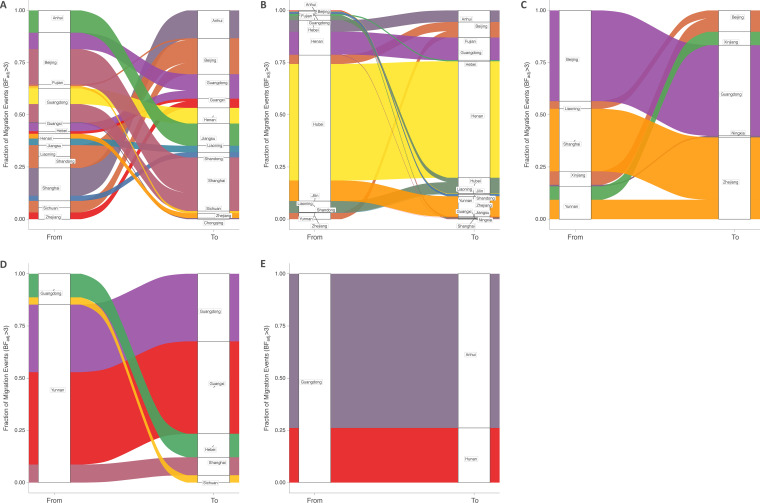
FIG 2.
Migration events between provinces in China. Sankey plot showing the proportions of migration events from each source province toward the recipient provinces. Left side of the plots shows the source of migration events. Right side of the plots shows the destination of migration events. Only results with adjusted Bayes factors (BFadj) of ≥3 are shown. CRF01_AE (A), subtype B/B′ (B), CRF07_BC (C), CRF08_BC (D), and CRF5501_B (E).

