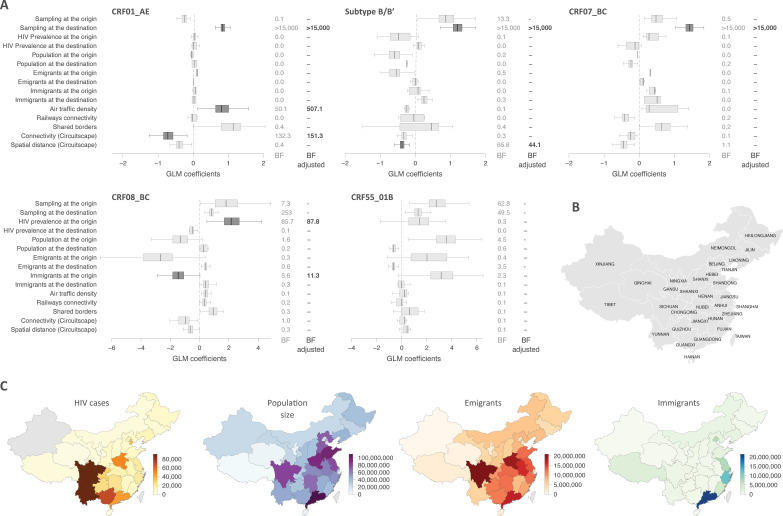
FIG 3.
Predictors of transition rates among locations. (A) The boxplots report the posterior distribution of each GLM coefficient, i.e., the contribution of each predictor to the model, when included in the model (the conditional effect size). The adjusted BFs after accounting for sampling heterogeneity are reported when ≥3, and the corresponding conditional effect sizes are plotted in darker gray. (B) Map of the Chinese Provinces (Database of Global Administrative Areas [GADM; https://gadm.org]). (C) Variables tested as predictors of dispersal transition rates across locations. Data for number of HIV cases per province were obtained from the National Bureau of Statistics of China (98) and the China National Center for Disease Control and Prevention (16). Data for population size (in millions) and data for numbers of emigrants and immigrants were obtained from the National Bureau of Statistics of China (98). The numbers of sequences sampled at the origin/destination (see Fig. 1) were also included in the GLM to account for the potential impact of sampling biases within the analysis (39).

