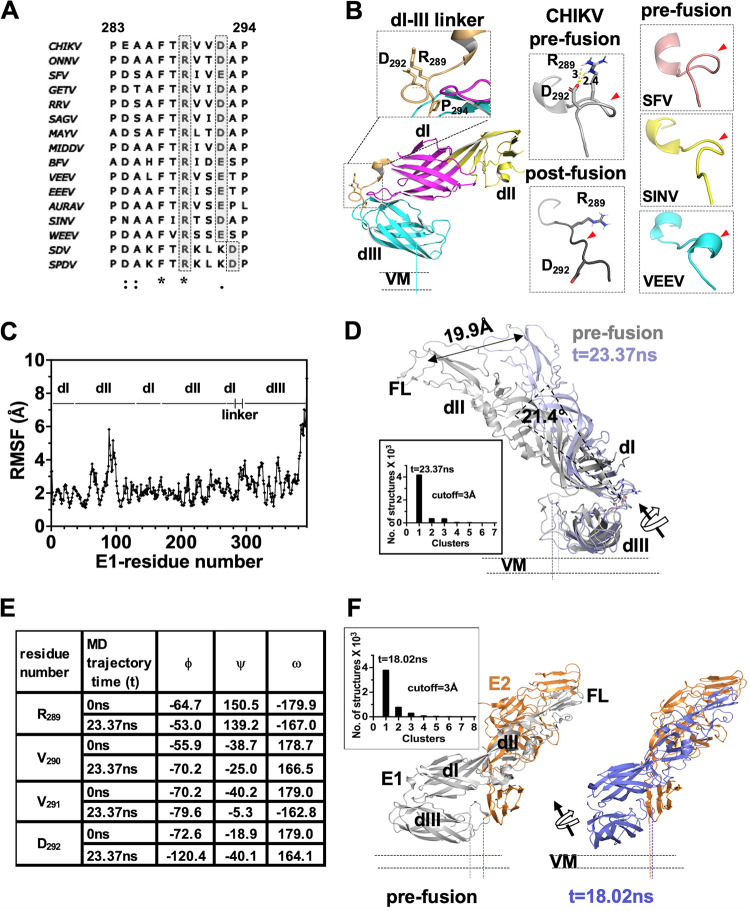
FIG 2.
Analysis of alphavirus E1 dI-III linker region in pre- and postfusion states and MD simulation analysis. (A) Multiple-sequence alignment of the alphavirus E1 dI-III linker. A conserved arginine-aspartate/glutamate pair is highlighted in gray. Sequence numbering is as per the CHIKV E1 sequence. (B) The left column shows the structure of the dI-III linker from CHIKV E1 (from PDB ID 3N42) in the prefusion conformation (cartoon representation). The conserved arginine (R289) and aspartate (D292) pair is shown in sticks. An enlarged image of the boxed region of the dI-III linker is shown in the inset above. The main chain hydrogen bond holding the spring twist region is shown by a yellow dotted line. The middle column shows the CHIKV E1 dI-III linker region in the prefusion and postfusion conformations. The distance between R289 and D292 side chain atoms is shown, and the salt bridge is shown by a yellow dotted line. The right column shows the dI-III linker regions from prefusion structures of SFV, SINV, and VEEV. In the middle and right columns, the dI-III linker is shown in a different orientation compared to that in left column, and red arrowheads point to the spring-twisted region of the linker. (C) Root mean square fluctuation (RMSF) analysis of the only E1 MD simulation trajectory. The sequence stretch is mapped to the corresponding domain (dI, dII, dIII, or dI-III linker). (D) Structural overlay of the t = 23.37-ns cluster central structure from MD simulations (slate) over the prefusion crystal structure of E1 (from PDB ID 3N42). Cluster analysis of the run is shown graphically in the inset. (E) Comparison of main chain dihedral angles (N-Cα, ϕ; Cα-C, ψ; C-N,: ω) of “RVVD” residues from the dI-dIII linker region between the t = 0-ns and t = 23.37-ns structures from E1 MD simulation studies. (F) Cluster analysis of MD simulation of E2-E1 structure. Insets show cluster analysis graphically. In panels D and F, displacement of the center of mass of dI-II regions in the MD simulation is depicted by a double-headed arrow. Rotation of the dI-II virtual axis over the dI-III linker is shown with a curved arrow. The centers of mass of dI-II regions were estimated using the center_of_mass.py script from the PyMol script repository.

