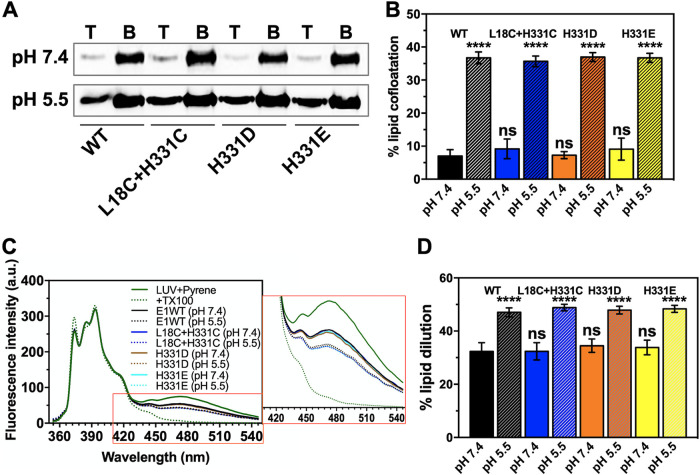
FIG 4.
Functional characterization of the E1 WT and cystine staple mutant in liposome coflotation and pyrene excimer fluorescence assays. (A) Image of Western blots for the E1 WT and dI-III cystine staple and H331D/E mutant proteins in the top (labeled “T”) and bottom (labeled “B”) fractions from the lipid flotation assay. (B) The fraction of E1 cofloating with LUVs (average of three experiments) is presented as a bar graph. (C) Pyrene emission spectrum in the presence of the E1 WT or cystine staple or H331D/E mutant proteins at pH 7.4 and 5.5. LUV plus pyrene (green solid line) acted as control (zero value of lipid dilution because of E1 FL insertion). The spectrum with pyrene-incorporated LUVs plus Triton X-100 (TX100) (green dotted line) was used to calculate the 100% value of lipid dilution. The E1 WT at pH 7.4 (solid black line) and E1 WT at pH 5.5 (dotted black line) are one comparison set, while spectra with the E1 dI-III cystine staple mutant (L18C+H331C) or H331D/E mutants at pH 7.4 (solid blue line) and 5.5 (dotted blue line) are the other comparison sets. The pyrene fluorescence emission spectrum was recorded in the 350- to 550-nm wavelength range. The excitation wavelength was set to 340 nm, and the excitation and emission slit widths were set to 5 nm. Each spectrum was an average of three readings and blank corrected. Emission spectra were normalized by setting constant the pyrene emission monomer peak at 397 nm. An inset shows an enlarged picture of the spectrum region between 420 and 540 nm. (D) The effect on lipid membrane due to E1 association as a percentage of dilution of lipids was estimated by measuring the drop in pyrene excimer peak values at ∼475 nm, in the presence of the WT or the mutant protein. Average values from three experiments are plotted in the bar graph along with error bars. One-way analysis of variance (ANOVA) was used to calculate statistical significance. ****, P ≤ 0.0001; ns, not significant.

