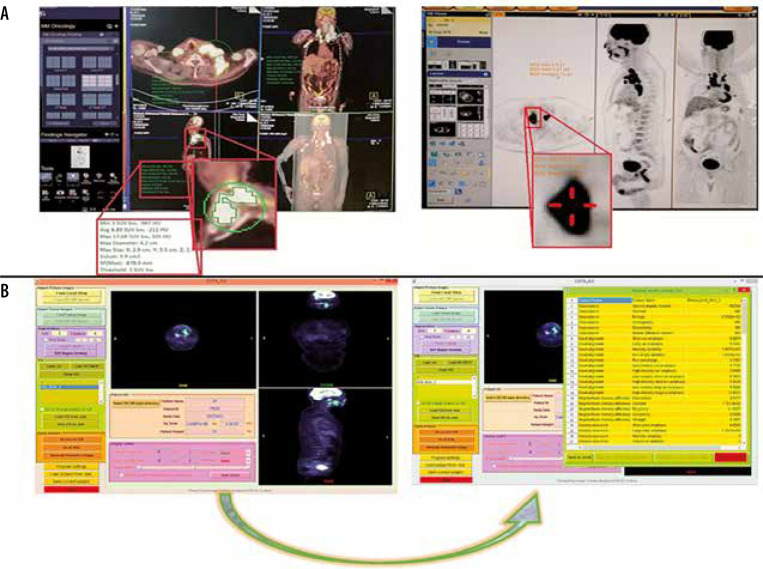
Figure 1.
A) The figures describe traditional standardised uptake value (SUV) measurements through different positron emission tomo graphy–computed tomography (PET/CT) workstation and (B) figures describe steps of features extraction through Chang-Gung Image Texture Analysis (CGITA) package code depending on given SUV. The CGITA GUI provides users with a simple image display interface that allows users to examine different slices and views. The computation of heterogeneity indices is achieved simply by button clicking. The current functions and interfaces of CGITA can be customized by users familiar with MATLAB programming. The screen shot here shows a subject with the 18F-FDG-PET images

