. 2020 Nov 6;43(4):e20200054. doi: 10.1590/1678-4685-GMB-2020-0054

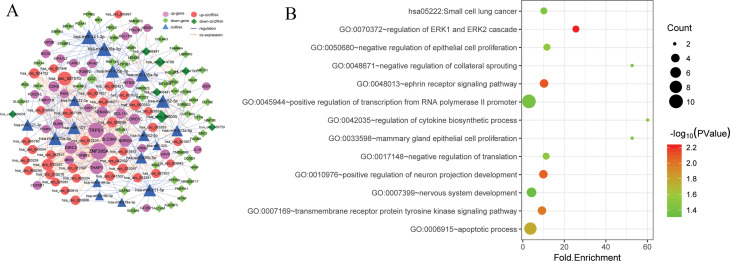
Figure 3. The ceRNA regulatory network and functional enrichment analysis of DEmRNAs in ceRNA network. (A) The ceRNA network. Pink circles represent up-regulated genes, blue triangles represent miRNAs, light green rhombuses indicate up-regulated cicrRNAs, deep green rhombuses represent down-regulated cicrRNAs, blue solid lines depict the regulatory relations among different RNA transcripts, and dotted orange line indicates the co-expression relationships. (B) Functional enrichment analysis of DEmiRNAs in ceRNA network. The dot size shows the gene ratio and color ranging from blue to red indicates the increasing significance.

Figure 3