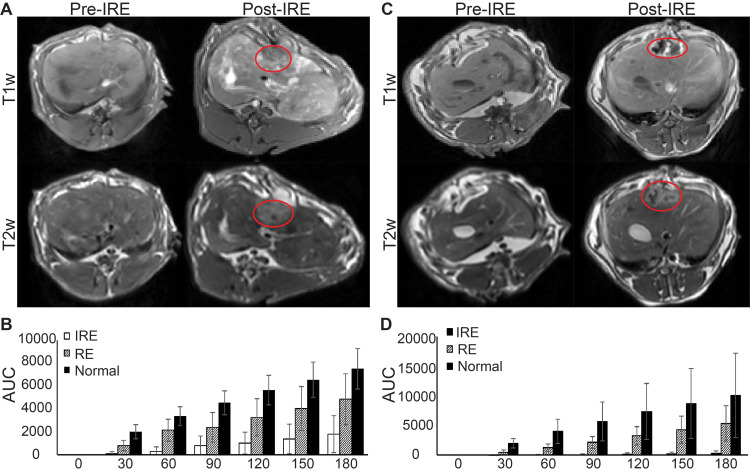
Figure 2.
MRI of normal liver and liver tumor tissues before and after IRE treatment and AUC analysis. (A) Representative T1w and T2w images of normal liver tissues before and approximately 20 min after IRE procedure. (B) AUC analysis of normal liver tissue TRIP-MRI after IRE. A significant difference was found between AUC among IRE zone, RE zone, and untreated tissues at 30–180s after contrast arrival (P<0.05). (C) Representative T1w and T2w images of liver tumor tissues before and approximately 20 min after IRE procedure. (D) AUC analysis of liver tumor tissue TRIP-MRI after IRE. A significant difference was found between AUC among IRE zone, RE zone, and untreated tissues at 30–180s after contrast arrival (P<0.05). Red lines enclose margins of IRE treatment.

