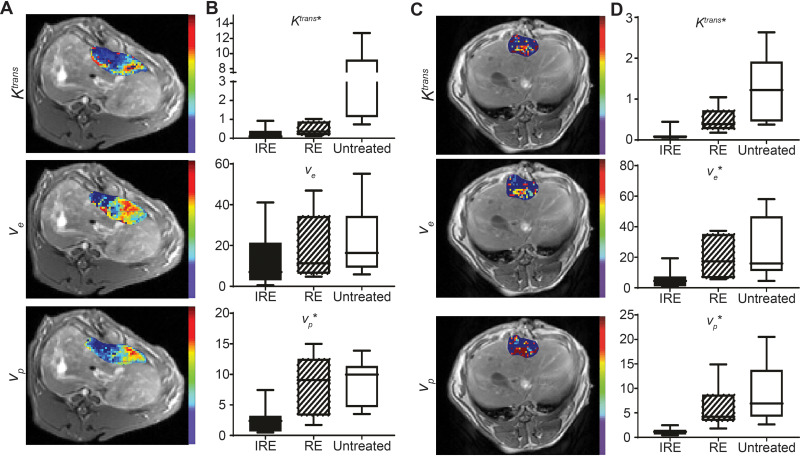
Figure 3.
Quantitative analysis of normal liver and liver tumor TRIP-MRI after IRE. (A) Representative Ktrans, ve, and vp maps of IRE treated normal liver tumor overlaid on corresponding T1w images. (B, D) Ktrans, ve, and vp intensities in each of the treatment regions of normal liver and liver tumor, respectively. (C) Representative Ktrans, ve, and vp maps of IRE treated liver tumor overlaid on corresponding T1w images.

