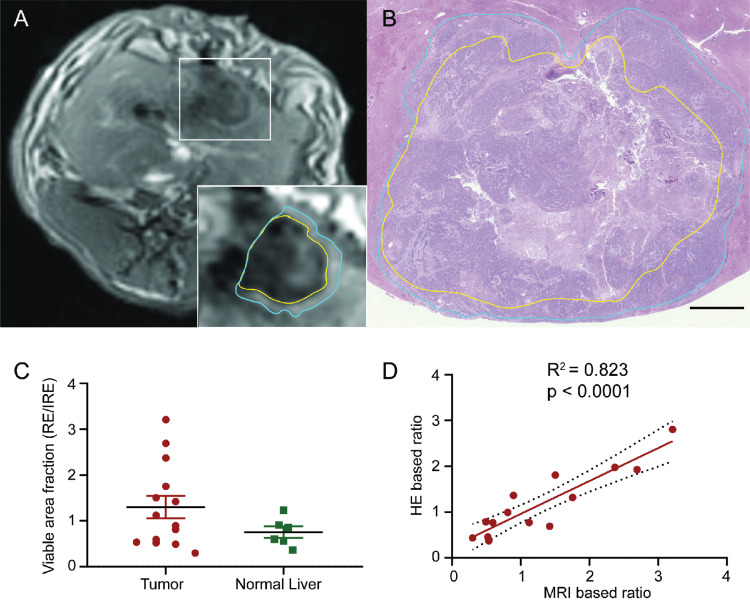
Figure 5.
Comparison of IRE treatment zones on MRI and histology. (A) Representative T1w axial image of IRE treated tissues. The yellow border represents the central IRE zone and blue border represents the peripheral RE zone. (B) Representative HE-stained histologic section of IRE treatment tissues at a section correlating with the section in A. The yellow border represents the central IRE zone and blue border represents the peripheral RE zone. (C) Histology-based viable area fraction of IRE treated tissues, calculated as RE zone area divided by IRE zone area. No significant difference was found between tumor and normal liver VAFs. (D) Correlation of MRI calculated VAF with gold standard histology-based VAF for each animal Significant positive correlation was found between MRI and HE based ratios (R2=0.832, P<0.001). Histology slices were acquired immediately after post-IRE MRI acquisitions.

