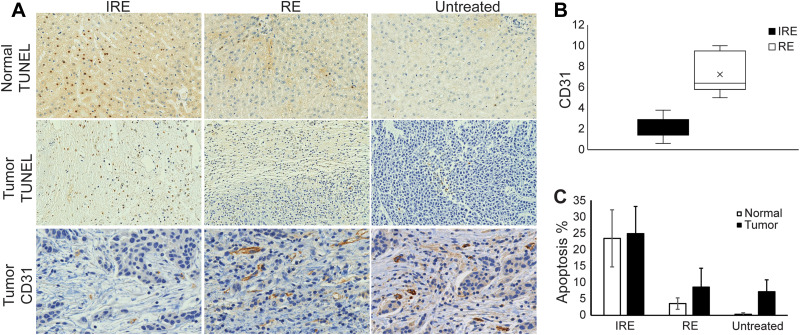
Figure 6.
Histology staining and quantification. (A) Representative histologic images of treated normal liver tissues stained for TUNEL and treated liver tumor tissues stained for TUNEL and CD31. (B) Comparison of cells staining positively for CD31 in IRE zone and RE zone of tumors after IRE treatment. RE zone demonstrated significantly higher CD31 staining compared with the IRE zone (P<0.05). (C) % apoptosis in tumor and normal IRE-treated tissues. No significant difference was found between normal liver and liver tumor tissue apoptosis in all treatment. Histology slices were acquired immediately after post-IRE MRI acquisitions.

