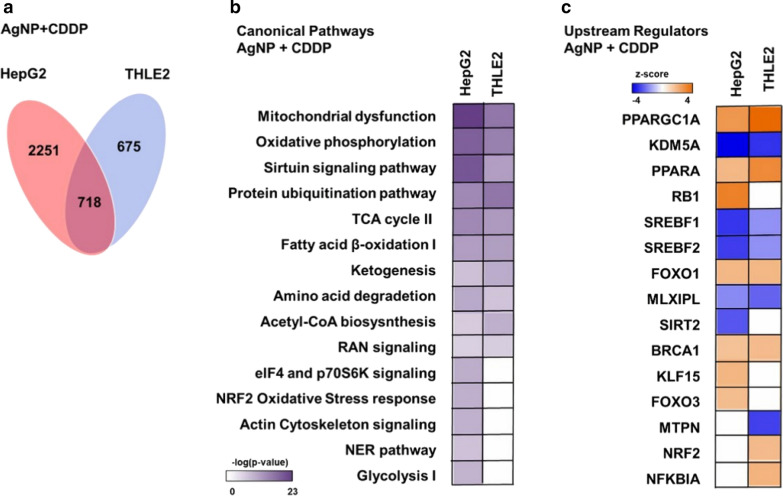
Fig. 7.
Venn diagram built to show proteins deregulated by AgNPs/CDDP overlap in both cell lines. a Number of proteins uniquely deregulated: HepG2 cells, 2251 proteins; THLE2 cells, 675 proteins; 718 proteins were in common deregulated in both cell lines. b Comparison of main significantly affected [− log(p-value) ≥ 1.3] canonical pathways between HepG2 and THLE2 cell lines, after AgNPs/CDDP exposure, indicated by IPA software. c Top active (z-score ≥ 2) and inactive (z-score ≤ − 2) upstream regulators in HepG2 and THLE2 cells after 24 h of exposure to AgNPs/CDDP, indicated by IPA software

