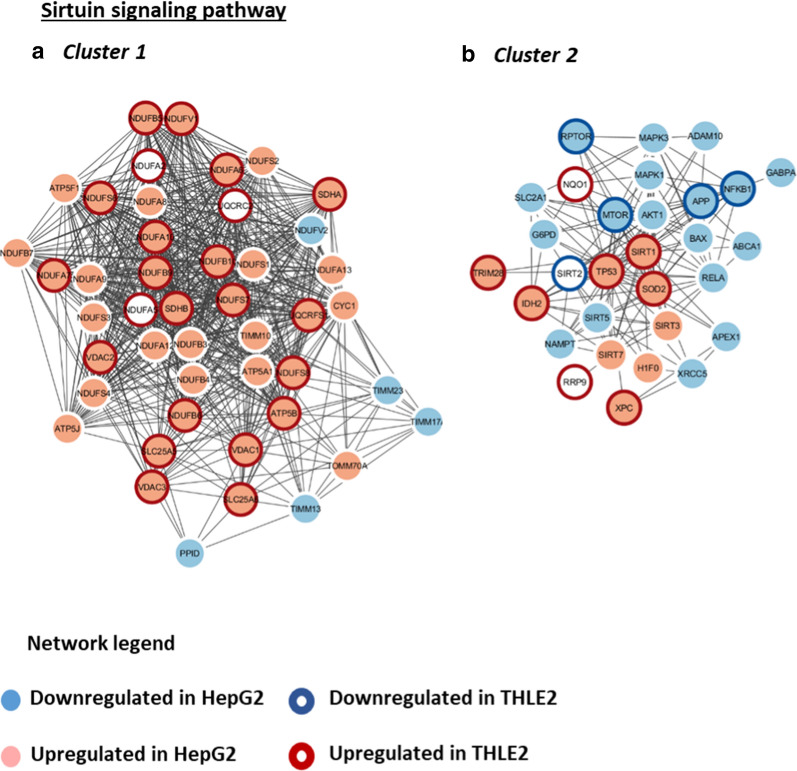
Fig. 9.
Protein–protein interaction networks of the sirtuin canonical pathway affected by AgNPs/CDDP exposure in HepG2 and THLE2 cells. We built functional interaction networks of deregulated proteins of each pathway with the STRING algorithm. Lines represent interactions and only interactions with medium confidence (score ≥ 0.4) are shown. We used the Markov cluster algorithm (MCL) to identify clusters of tightly connected proteins within the network. Upregulated proteins in HepG2 cells are light red, whereas downregulated proteins are light blue. For THLE2 cells, a dark red halo around a protein indicates that the protein is upregulated, whereas a dark blue halo indicates that the protein is downregulated

