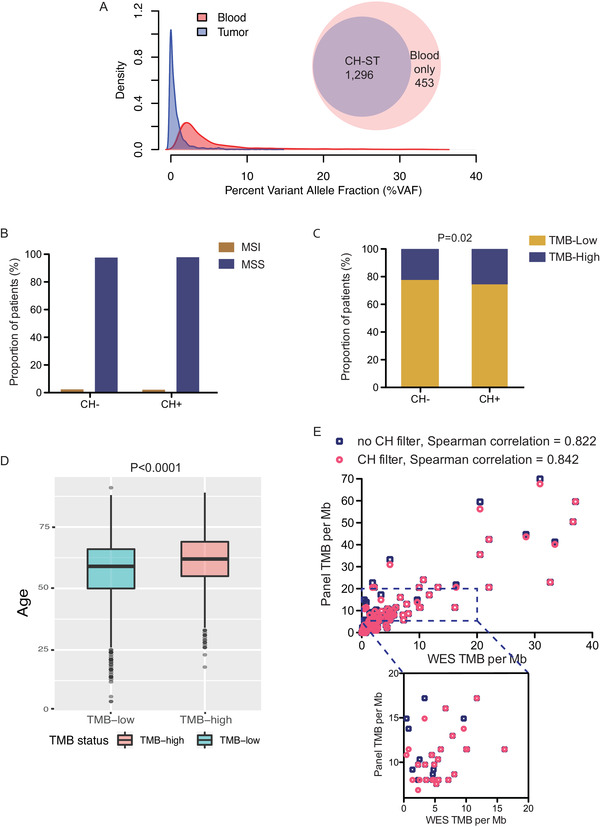
FIGURE 3.

Associations of immunotherapy biomarkers with CH. A, Density of CH variant allele fraction in blood and tissue samples. Venn Diagram showing the fraction of CH variants detected in the respective solid tumor. B, The proportions of MSI patients between CH− and CH+ patients were not different (P = .65, chi‐square test). C, Higher proportion of TMB‐high patients in the CH+ compared with CH− populations (P = 0.02, chi‐square test). D, Association between high TMB and older age. E, Correlations of TMB between exome and panel sequencing with (circles) or without (squares) CH filtering in an independent cohort of 175 patients from whom tumor and matched normal samples were each sequenced
