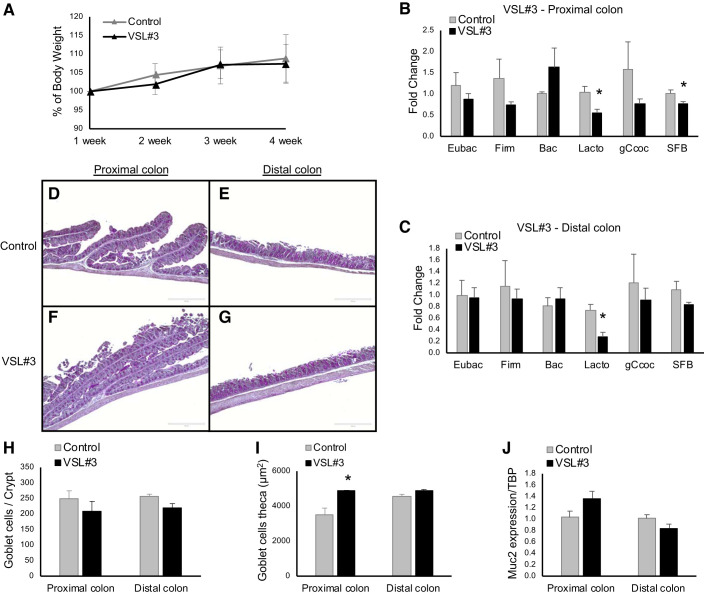
Fig. 4.
The probiotic VSL#3 supplementation on Na+/H+ exchanger isoform 8 knockout (NHE8KO) mice. A: the body weight differences in percentage comparing control group with VSL#3 treatment. B: quantitative analysis of bacterial groups in the proximal colon comparing NHE8KO mice with VSL#3-treated NHE8KO mice. C: quantitative analysis of bacterial groups in the distal colon comparing NHE8KO mice with VSL#3-treated NHE8KO mice. The fold changes are comparing relative abundance of the targeted bacterial groups between control mice and treated mice. D–G: periodic-acid Schiff (PAS) staining from the proximal colon and distal colon of NHE8KO mice and VSL#3-treated NHE8KO mice. H: number of goblet cells per crypt. I: goblet cell theca (µm2). J: Muc2 mRNA expression. PAS staining (×10) magnification. PAS-positive cells were quantified using ImageJ program. TBP, TATA-binding protein; Eubac, Eubacteria; Firm, Firmicutes; Bac, Bacteroidetes; Lacto, Lactobacillus; gCcoc, Clostridium coccoides; SFB, segmented filament bacteria. Data are represented as means ± SE from 5 mice. *P ≤ 0.05.

