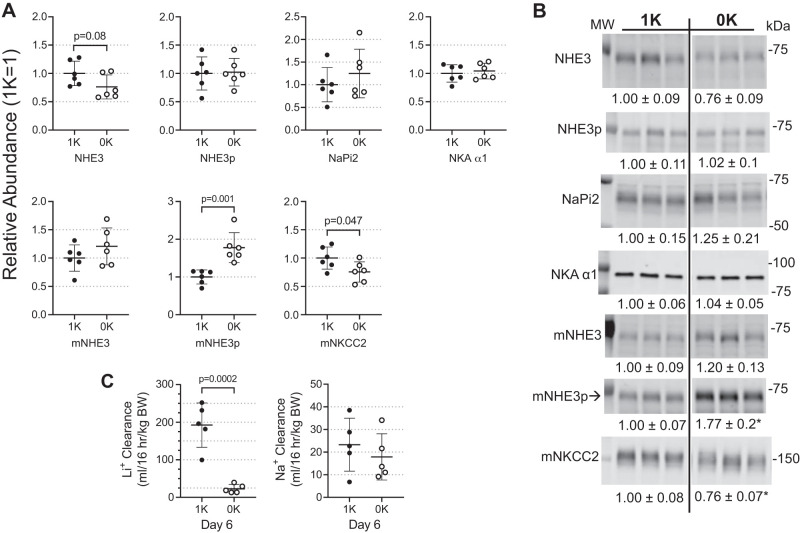
Fig. 4.
Response of renal cortical proximal nephron and medullary thick ascending limb Na+ transporters to K+-deficient (0K) state. Na+ transporters were assayed by immunoblot. 1× and ½× loading amounts were assayed to confirm linearity of detection system (one amount is shown above); assay and antibody details are provided in Table 1. A: individual values are plotted as relative abundance normalized to mean of the 1% K (1K) group = 1; displayed as means ± SE (n = 6/group). Shown are Na+/H+ exchanger isoform 3 (NHE3); NHE3 phosphorylated at Ser 552 (NHE3p); Na+-Pi cotransporter isoform 2 (NaPi2); Na+,K+-ATPase α1-subunit (NKAα1); medullary NHE3 (mNHE3); mNHE3 phosphorylated at Ser 552 (mNHE3p); and Na+,K+,2Cl− cotransporter isoform 2 (mNKCC2). B: typical immunoblots with means ± SE calculated for n = 6/group and n = 3/group shown for simplicity. MW indicates molecular weight in kDa. C: clearance of Li+, an estimate of volume flow leaving the proximal tubule and medullary thick ascending limb, calculated classically as CLi = ([U/P]Li × UV])/body wt. Clearance of Na+ calculated by CNa = ([U/P]Na × UV])/body wt. Comparisons were performed using GraphPad Prism parametric unpaired Student’s t test. P values are provided; *P < 0.05 in B.

