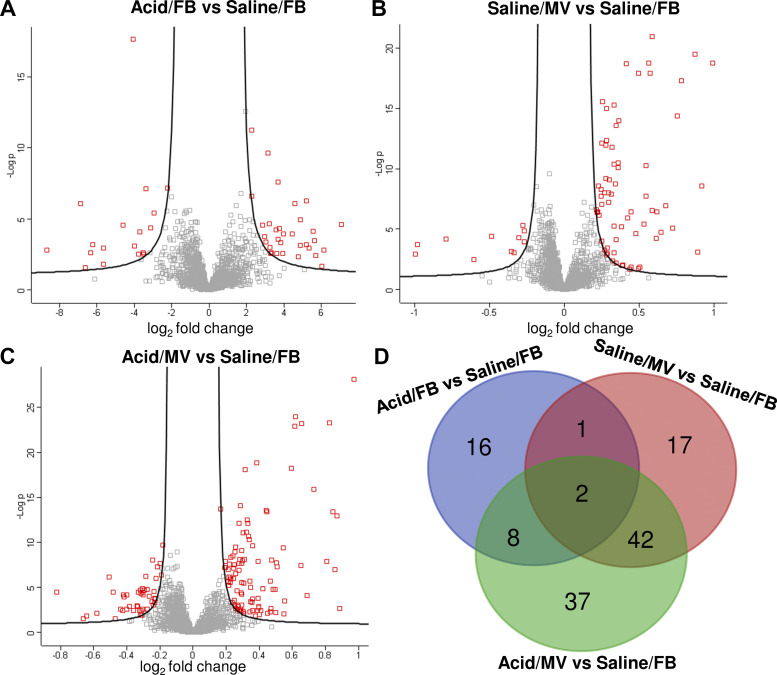
Fig. 3.
Overview of the differentially expressed proteins. Volcano plots for all quantified proteins (n = 1943) from proteomic analyses show −log10 P values (y-axis) versus the log2 fold change (x-axis). The differentially expressed proteins are highlighted in red: Acid/FB vs. saline/FB (A), saline/MV vs. saline/FB (B), Acid/MV vs. Saline/FB (C). The Venn diagram (D) depicts the number of overlapping and uniquely altered proteins among the three groups. FB, free-breathing; MV, mechanical ventilation.

