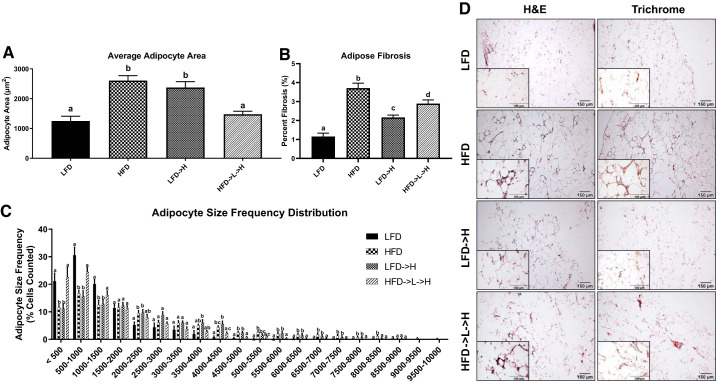
Fig. 2.
Epididymal adipose tissue of weight-cycling mice is smaller in area and contains a smaller adipocyte size frequency distribution. A: average adipocyte area measured from hematoxylin-eosin (H&E)-stained tissue sections. B: quantitative analysis of collagen deposition in epididymal fat pad. C: frequency distribution analysis of adipocytes measured in 500-μm increments indicating weight-cycling mice have different adipocyte sizes compared with HFD and LFD→H mice. D: representative ×10 H&E and Trichrome stains of epididymal adipose tissue; insets are ×40. LFD, low-fat diet for 32 wk; HFD, high-fat diet for 32 wk; LFD→H, LFD for 28 wk and then changed to a HFD for 4 wk; HFD→L→H, HFD for 21 wk, then changed to LFD for 7 wk, and then changed to HFD for 4 wk. Data are shown as means ± SE (n = 8–10/group). Bar graphs not sharing a common letter are significantly different from one another according to one-way ANOVA (P < 0.05).

