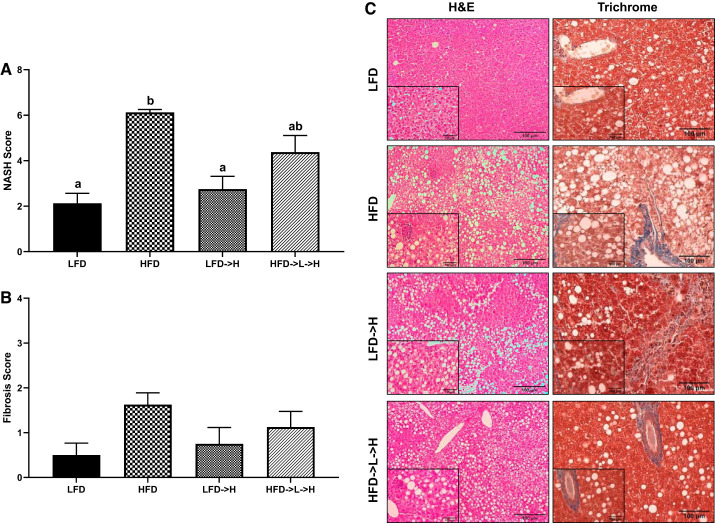
Fig. 4.
Weight cycling results in similar nonalcoholic steatohepatitis (NASH) score as mice on a sustained high-fat diet. A: NASH score. B: fibrosis score. C: representative ×20 hematoxylin-eosin (H&E) and Trichrome stains of liver tissue; insets are ×40. LFD, low-fat diet for 32 wk; HFD, high-fat diet for 32 wk; LFD→H, LFD for 28 wk and then changed to a HFD for 4 wk; HFD→L→H, HFD for 21 wk, then changed to LFD for 7 wk, and then changed to HFD for 4 wk. Data are shown as means ± SE (n = 8–10/group). Bar graphs not sharing a common letter are significantly different from one another according to one-way ANOVA (P < 0.05).

