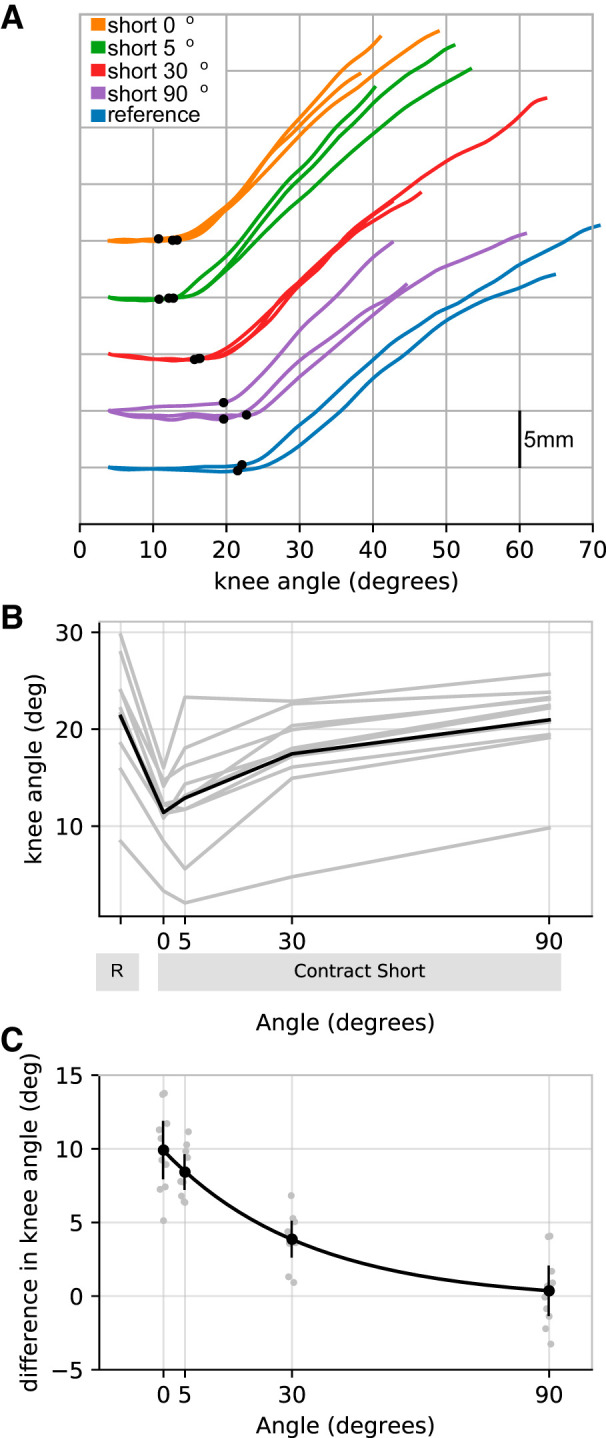
Fig. 4.

Experiment 3. Effect of stretch amplitude. A: raw data (all trials from a single participant). For clarity, initial fascicle lengths have been offset vertically for each experimental condition. B: mean muscle slack lengths for each participant (n = 10, gray lines) for the reference (R) and contract-short condition after stretches of 0, 5, 30, or 90°. The black line is the mean of the participants’ means. C: difference in muscle slack lengths between the reference condition and the corresponding contract-short condition for each stretch amplitude. Individual participant means (gray circles) are shown, as are the means of participants’ means (black circles with 95% confidence intervals). The black line is an exponential fit.
