FIGURE 3.

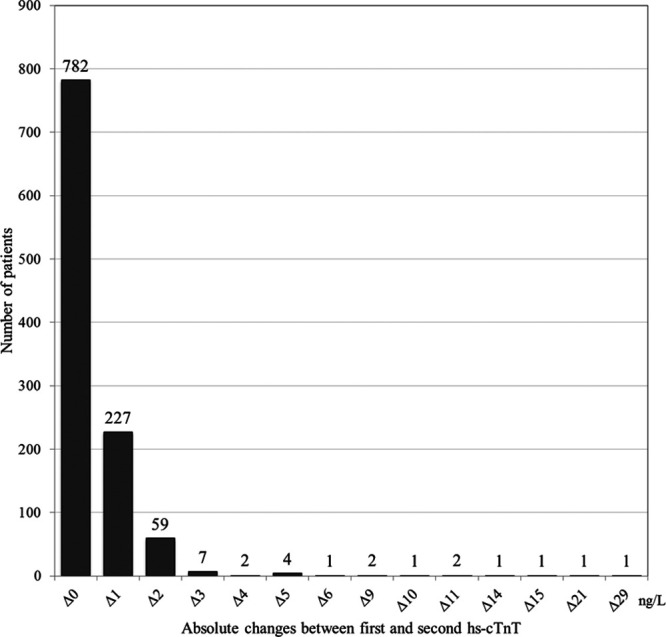
Distribution of absolute change in hs-cTnT in chest pain patients with a baseline value of ≤14 ng/L and 2 hs-cTnT values obtained within a time period of >30 to ≤90 minutes, N = 1091. Δ indicates delta/absolute change.

Distribution of absolute change in hs-cTnT in chest pain patients with a baseline value of ≤14 ng/L and 2 hs-cTnT values obtained within a time period of >30 to ≤90 minutes, N = 1091. Δ indicates delta/absolute change.