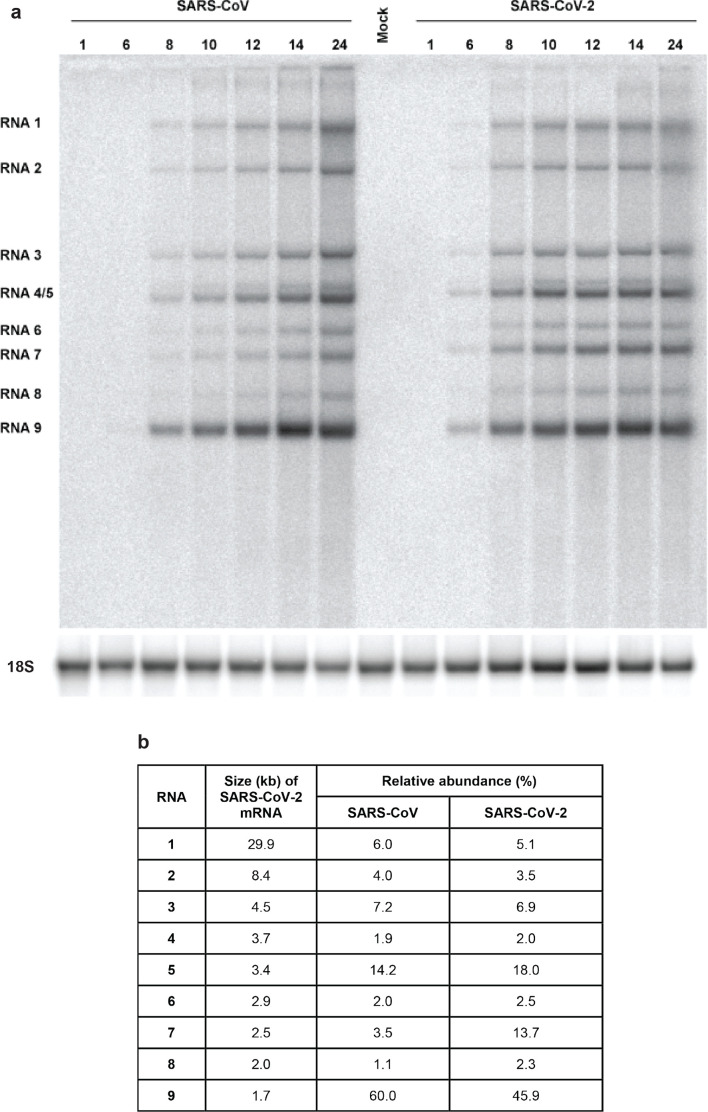
Fig. 3.
Kinetics of SARS-CoV-2 and SARS-CoV RNA synthesis in infected Vero E6 cells. (a) Hybridization analysis of viral mRNAs isolated from SARS-CoV-2- and SARS-CoV-infected Vero E6 cells, separated in an agarose gel and probed with a radiolabelled oligonucleotide recognizing the genome and subgenomic mRNAs of both viruses. Subsequently, the gel was re-hybridized to a probe specific for 18S ribosomal RNA, which was used as a loading control. (b) Analysis of the relative abundance of each of the SARS-CoV-2 and SARS-CoV transcripts. Phosphorimager quantification was performed for the bands of the samples isolated at 12, 14 and 24 h p.i., which yielded essentially identical relative abundances. The table shows the average of these three measurements. SARS-CoV-2 mRNA sizes were calculated on the basis of the position of the leader and body transcription-regulatory sequences (ACGAAC) in the viral genome [110, 111]

