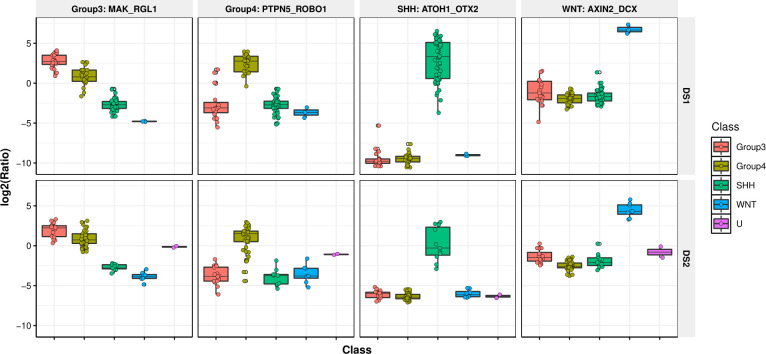
Fig 4. GERs associated with SHH and WNT are more discriminatory compared to Group 3 and Group 4 subtypes.
Boxplot of example GERs associated with molecular subtypes across 2 studies. DS1 represents the RNA-seq dataset EGAD00001001899 and DS2 represents the Microarray dataset GSE37418.

