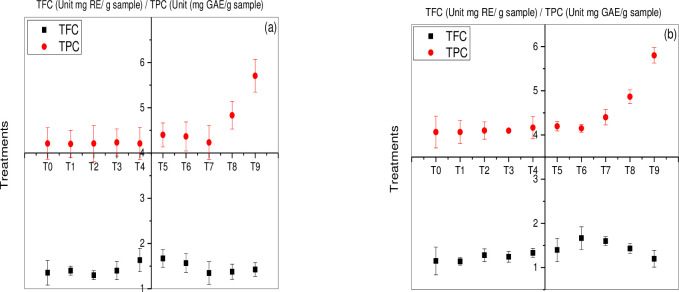
Fig 3. Total flavonoid content and total phenolic content in rapeseed (Brassica napus) varieties under varying stress of green synthesized Zn NPs.
The data is profiled in two different graphs for each variety (a) indicates rapeseed variety Faisal canola and (b) indicates Shiralee. Values are means of three biological replicates (±SD)., while P value was kept <0.05.

