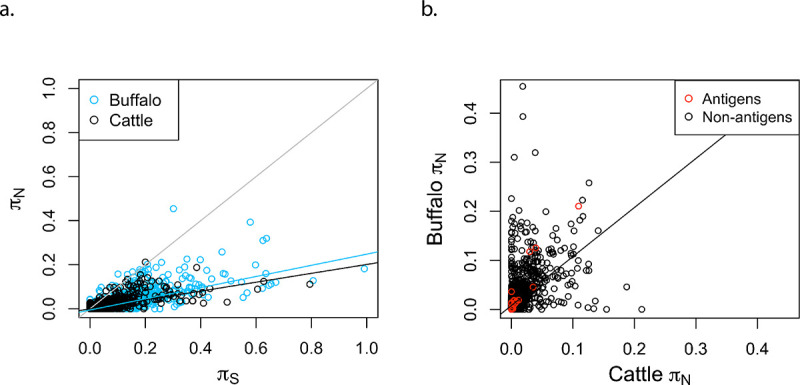
Fig 5. Nucleotide diversity in amino acid-changing (πN) and silent (πS) sites.

a. Rates of nucleotide diversity in non-synonymous (πN) and synonymous (πS) sites for all genes in the Muguga reference genome, both among the cattle strains (Muguga, Marikebuni and Uganda), and between the reference Muguga and the Buffalo_3081. The black regression line corresponds to π value for genes among cattle, the light blue regression line corresponds to the π value for genes among buffalo, and the black line represents y = x. b. For each gene, πN among cattle strains (X axis) is compared with πN in a buffalo-derived strain relative to the reference Muguga, (Y axis). Known antigens are colored red. The estimated slope regression line is shown, with a slope of 0.99. The R-squared value for the regression is 0.282. Note the shorter axes in 5b.
