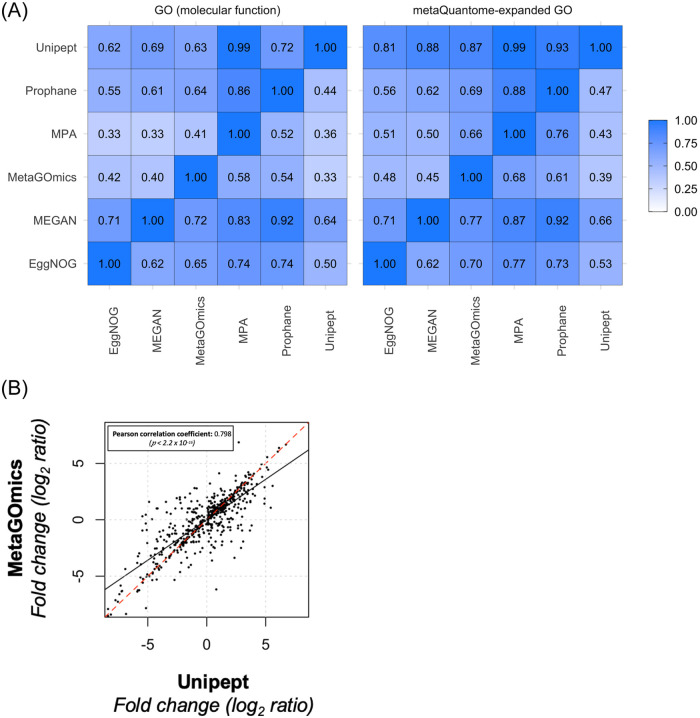
Fig 2.
A) Qualitative and quantitative comparison of functional tools. Overlap of unique molecular function GO terms (left) and expanded GO terms (right) were compared amongst the six functional tools. Values were calculated as a fraction of the size of the term intersection (between the tools labeled on the column and row) over the total term size of the tool listed on the horizontal axis (column). Each functional analysis software tool was compared against each other. For example, for molecular function GO terms (left panel), 90% of the unique MPA term set is present in Unipept’s unique term set. For molecular function expanded GO terms, the overlap is much larger for all tools within Unipept (right panel’s top row). B) Comparison of quantitative expression for molecular function GO terms from Unipept and MetaGOmics. Log2ratio of spectral counts ‘with sugar sample’ (WS) against ‘no sugar sample’ (NS) was calculated for MetaGOmics- and Unipept-generated molecular function GO terms. Unipept identified 1,109 molecular function GO terms, while MetaGOmics identified 900 molecular function GO terms. The data points in the figure represent quantitative values for 460 molecular function GO terms that overlapped between Unipept and MetaGOmics.

