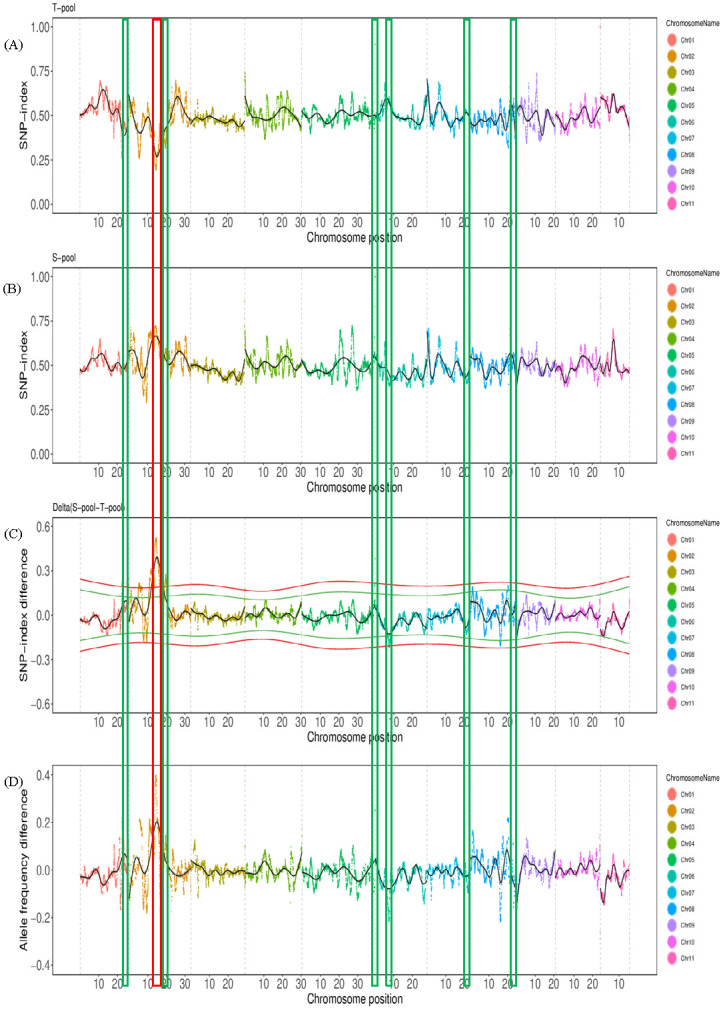
Fig 2.

SNP-index plots of T-pool (A) and S-pool (B) and Δ(SNP-index) plot (C) from the QTL-Seq analysis. The x-axis represents the position of eleven chromosomes and the y-axis represents SNP-index or Δ(SNP-index) value. The Δ(SNP-index) plot (C) shows statistical confidence intervals under the null hypothesis of no QTL (P < 0.01). The red and green wavy line means 99% and 95% confidence intervals, respectively. The promising genomic region identified for LRI associated with heat tolerance is highlighted at 11.03–19.25 Mb on Chromosome 2 by red frame. The other six QTL region with high Δ(SNP-index) value are highlighted by green frame. (D) Profile of the tolerant parent (L1) allele frequency difference (L1AFD).
