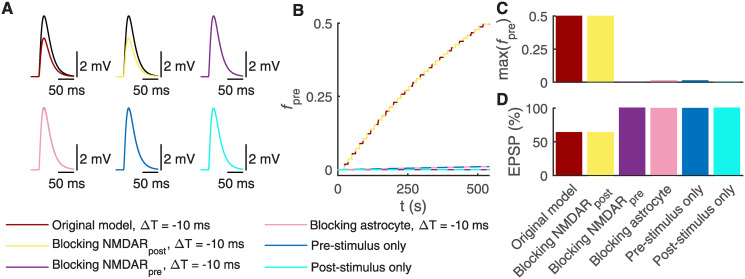
Fig 5. Blocking astrocytic Ca2+ signaling and presynaptic NMDARs prevents t-LTD induction.
(A) The postsynaptic EPSPs in the soma are shown before (black) and after t-LTD induction (other colors than black) when manipulating postsynaptic NMDAR, presynaptic NMDAR, or astrocytic signaling, or stimulation protocols (Fig 2A, 2H and 2O). In top left, the post-pre pairing protocol with the temporal difference ΔT = −10 ms induced t-LTD (same synapse model as in Fig 4). In top middle, blocking the postsynaptic NMDARs failed to prevent t-LTD with the post-pre pairing protocol for ΔT = −10 ms. In top right, blocking the presynaptic NMDAR, on the other hand, prevented t-LTD with the post-pre pairing protocol for ΔT = −10 ms. In bottom left, blocking the fine astrocyte process also prevented t-LTD with the post-pre pairing protocol for ΔT = −10 ms. In bottom middle, the presynaptic stimulus at a frequency of 0.2 Hz for 500 s failed to induce t-LTD. In bottom right, the postsynaptic stimulus at a frequency of 0.2 Hz for 500 s failed to induce t-LTD. (B) The fraction of presynaptic glutamate release inhibition (fpre) is shown during the whole t-LTD induction protocol for all six models described in (A). (C) The values of fpre at the end of the t-LTD induction protocol are shown for all six models described in (A). The high values of fpre led to t-LTD. (D) The EPSP percentage is given for all six models described in (A). We calculated the EPSP percentage for every ΔT by normalizing the EPSP amplitude occurring after t-LTD induction by the EPSP amplitude occurring before t-LTD induction, and multiplied them by 100%.

