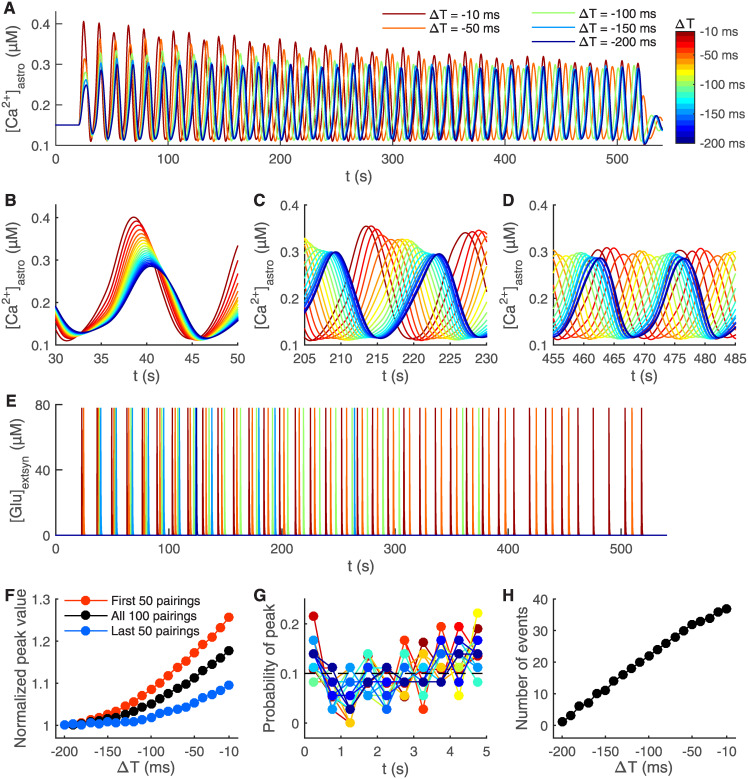
Fig 6. Shorter temporal difference between pre- and postsynaptic activity leads to shorter delay in astrocytic Ca2+ response and more frequent glutamate release from astrocyte.
The stimulation protocol used was the t-LTD induction protocol for every temporal difference ΔT between −10 ms and −200 ms at every 10 ms [12] (Fig 2H). The astrocytic Ca2+ concentration ([Ca2+]astro) is shown during the whole simulation of the 100 post-pre pairings for five different ΔT in (A), and with twenty different ΔT in the beginning of the simulation in (B), in the middle of the simulation in (C), and in the end of the simulation in (D). Color bar is given in (A). (E) The glutamate concentration in the extrasynaptic space ([Glu]extsyn) is shown for the whole simulation for five different ΔT. Glutamate was released every time the astrocytic Ca2+ concentration reached the threshold. (F) The normalized mean peak values of astrocytic Ca2+ concentration are shown during the first 50 post-pre pairings, last 50 post-pre pairings, and the whole 100 post-pre pairings of the t-LTD induction protocol with different ΔT. (G) The probability of astrocytic Ca2+ peaks is shown as a function of time between each post-pre pairing. Every 5 s long sweep between each of the post-pre pairings was divided into ten 0.5 s long bins. The time for the post-pre pairing was in the beginning of the 5 s long sweep. The probability of astrocytic Ca2+ peaks was calculated for every bin during the whole t-LTD induction protocol with different ΔT. The dashed line indicates the equal probability between the ten bins, so 0.1. Similarly to experimental data [15], Ca2+ peaks were not time-locked to the post-pre pairing onset. Color bar is given in (A). (H) The number of times the astrocyte released glutamate during the 100 post-pre pairings in the t-LTD induction protocol is shown with different ΔT.

