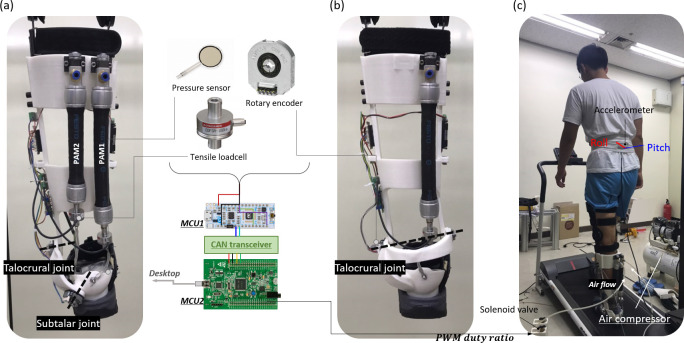
Fig 1. The overall system and experimental environment.
(A) and (B) represent the 2- and 1-DOF PAFOs, respectively. (C) shows the experimental setup. The subject wore an in-show pressure sensor and IMU on the trunk and walked on the treadmill. The figure also shows the flow of data. The signals detected by the PAFO sensors are measured by micro controller unit 1 (MCU1; STM Nucleo board) mounted on it and transferred to MCU2 (STM Discovery board) via CAN communication. MCU2 generates a PWM signal for solenoid valve control and enables serial debugging in the desktop through simultaneous serial communication. And the individual in this figure has given written informed consent (as outlined in PLOS consent form) to publish these case details.

