
Fig 5. Stabilogram of the trunk angular acceleration using a density plot.
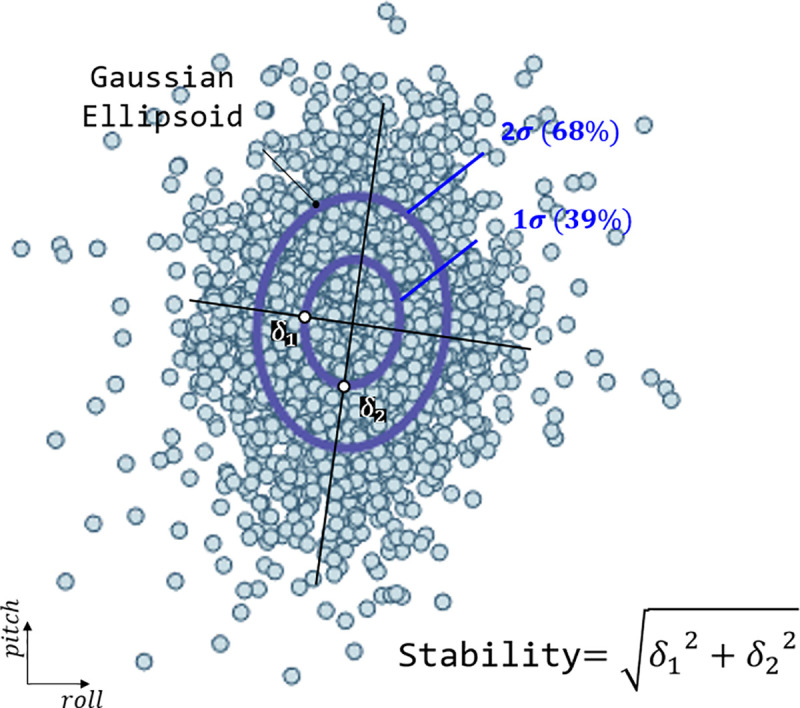
Converting to a Gaussian ellipsoid through covariance calculation makes the comparison easier, as shown on the right. In the figure, δ1 and δ2 represent 2 standard deviations of covariance and are used as vertices of the Gaussian ellipsoid.