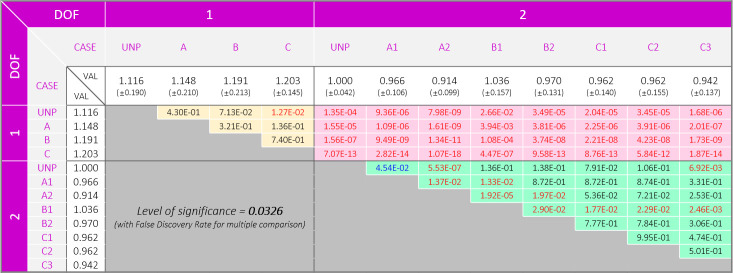
Fig 7. P-table of the stabilogram.
The values with blue and red colors represent significant differences of p<0.05 and p<0.0326 for before and after correction, respectively. A significance level of 0.0326 was determined on the basis of FDR. The shadows colored in yellow, pink, and green represent comparisons between 1 DOF − 1 DOF, 1 DOF − 2 DOF, and 2 DOF − 2 DOF, respectively.

