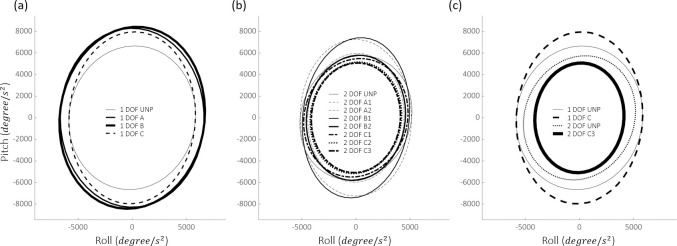
Fig 8. Experimental results of the stabilogram for subject 2.
(A) and (B) The results of the experiments that used the assistance techniques demonstrated in Table 1 with 1- and 2-DOF PAFOs, respectively. (C) The stabilogram of the unpowered and maximum output states of 1- and 2-DOF PAFO experiments for comparison. The circles represent 1δ of covariance, which comprised 39% of the data. 2δ (68%) and 3δ (99%) are not shown for clarity of comparison, as they are simple magnifications.

