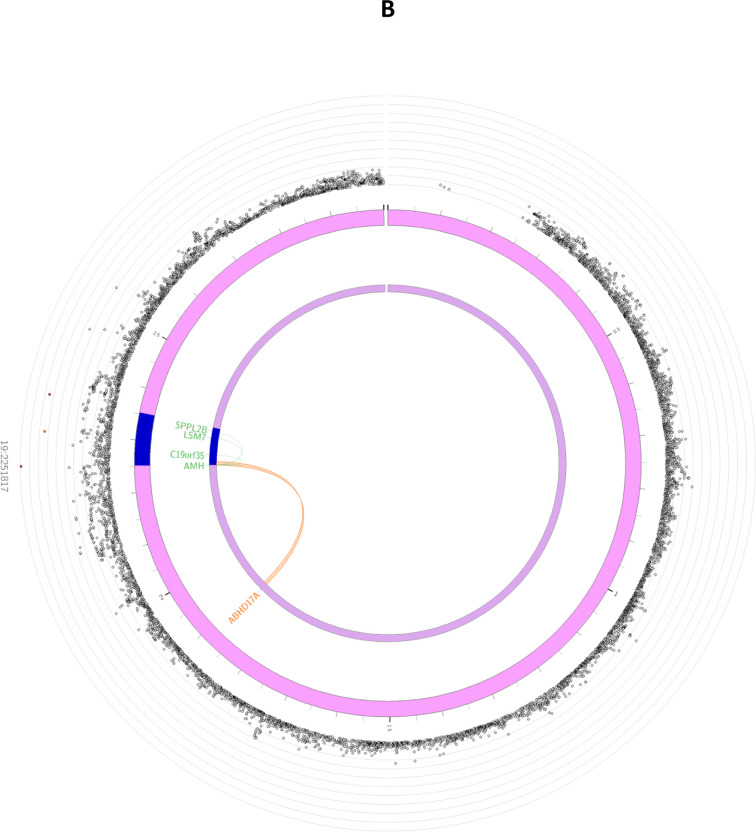
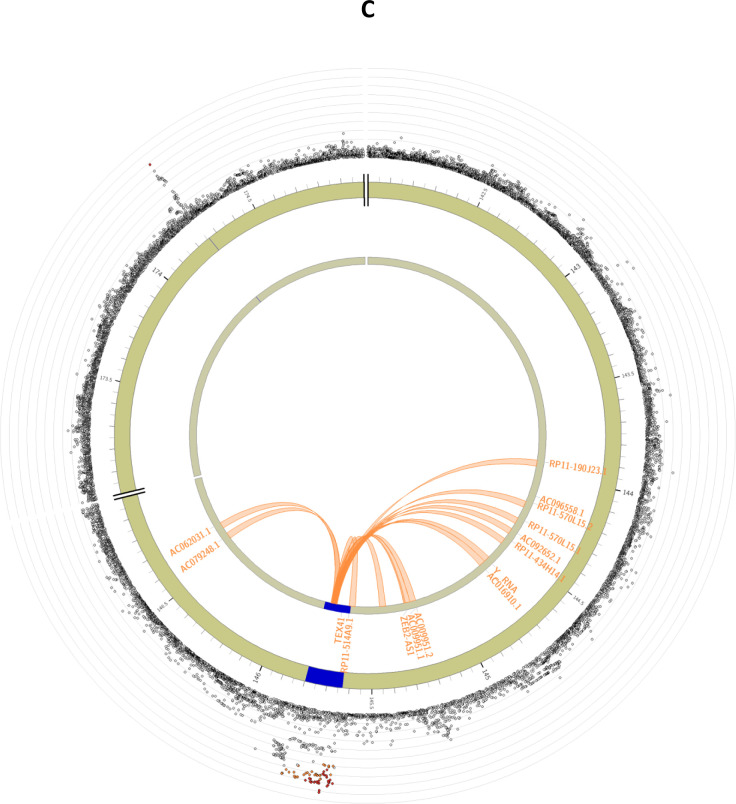
Figure 2: Circos plots for the genome-wide significant loci for inverse normally transformed AMH in women.
Circos plots are presented for each of the identified loci: MCM8 (panel A), AMH (panel B), TEX41 and CDCA7 (panel C). The outer layer represents the Manhattan plot. The second (including genomic positions) and third layers represents the chromosome ring, genomic risk loci are depicted in blue. Only genes mapped by either eQTLs or chromatin mapping are plotted. Genes only mapped by eQTLs are green, genes only mapped by chromatin interactions are orange, and genes mapped by both have a red colour. Orange coloured lines represent chromatin interactions, green coloured lines are eQTL links. Plots were created using the FUMA platform26.


