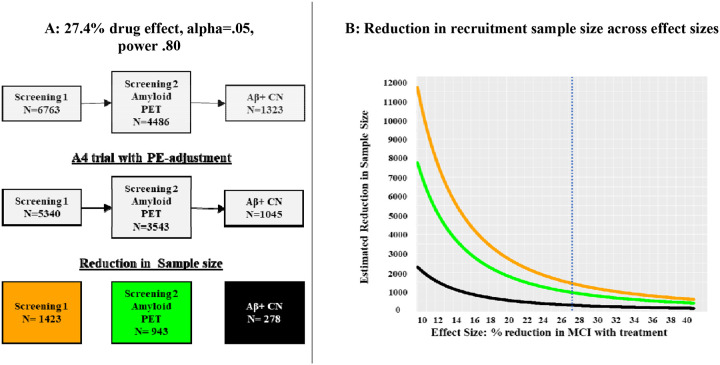
Figure 4:
Comparison of recruitment design for detection of a drug effect based on A4 Study33 recruitment. Using sample size estimates from Figure 3, we present how planning to adjust for practice effects would alter a clinical drug trial, using A4 Study recruitment as an example. The A4 Study had a total sample of 1323 participants after recruitment as shown in the top row of gray boxes (based on Figure 1 in Sperling et al., 2020). [25] A: Based on sample size estimates from Figure 3, a sample of 1323 would enable a study to detect a significant drug effect of 27.4% at an alpha of .05 and .80 power. The top row of the flow chart presents the recruitment for the A4 study. This study reported an initial screening (6763 participants) followed by amyloid PET (4486 participants) imaging to achieve their sample of 1323 amyloid-positive (AB+), cognitively normal (CN) participants. Achieving the final sample size thus required an n for the initial screening that was 5.11 times as large as the final sample size, and an n for amyloid PET imaging that was 3.39 times as large as the final sample. Our power analyses suggest that the same effect size is achieved with only 1042 participants if a trial adjusted follow-up scores for practice effects. That, along with the reductions in initial screening and PET scans, is shown in the middle row of the flow chart. The bottom row shows the sample size reductions for initial screening, PET screening, and the initial biomarker-positive and cognitively normal sample. B: The figure presents the reduction in recruitment sample size (Y-axis) across effect sizes ranging from 10% to 40% (X-axis). The orange line represents how many fewer participants would be necessary at initial screening if a study had planned to adjust for practice effects at follow-up. The green line represents how many fewer participants would be necessary for amyloid PET imaging if a study had planned to adjust for practice effects at follow-up. The black line represents what the final sample size would be. The numbers were calculated for each effect size in the way described in panel A. Each curve was calculated for each effect size at 1% increments in the manner described in panel A. The dotted blue line shows at effect size of 27.4%.

