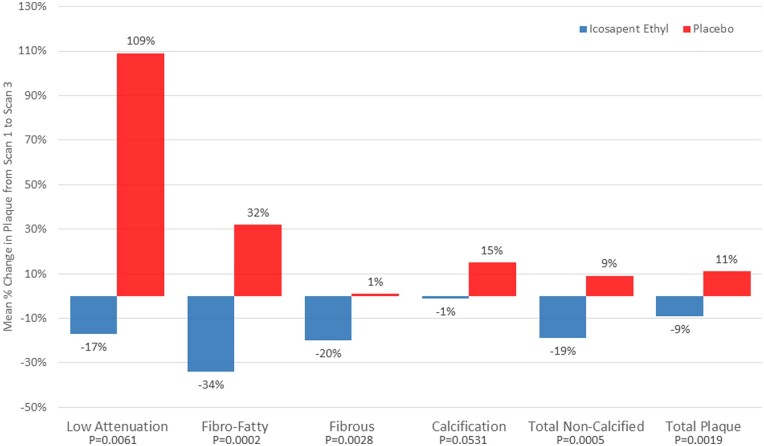
Figure 1.
Mean plaque progression for each type of plaque composition measured on cardiovascular CT for the icosapent ethyl and placebo groups (icosapent ethyl group, n = 31 and placebo group, n = 37) after multivariable adjustment. Univariable analysis and multiple linear regression were used to examine the change in plaque levels between the cohorts. Multivariable models were adjusted by age, sex, diabetes status, hypertension, and baseline triglyceride levels. All statistical analyses report two-sided P-values for the outcomes. A P-value <0.048 was considered significant for the outcomes.

