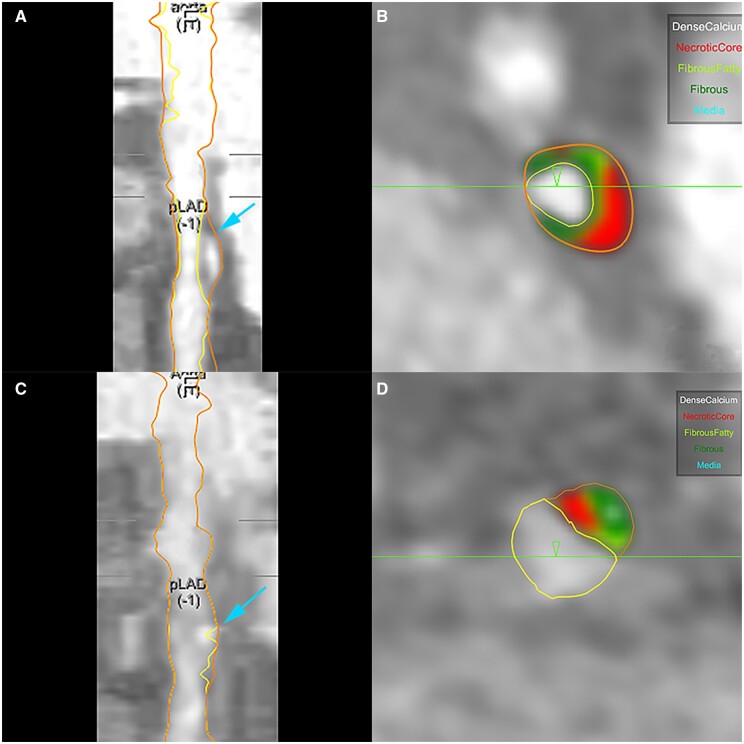
Figure 2.
54 year old male with history of diabetes, hypertension, and hyperlipidaemia on optimal statin therapy randomized to icosapent ethyl and followed for 18 months. Figures (C and D) demonstrate significant regression of LAP (in red) compared with baseline (A and B). (A, B) Coronary Segmentation model of proximal LAD and quantitative measurement of different plaque types at baseline. (C, D) Coronary Segmentation model of same site in proximal LAD and quantitative measurement of different plaque types at 18-month follow-up. Dense Calcium: white; Necrotic Core or Low-Attenuation Plaque: red; Fibrous Fatty: light green; Fibrous: dark green.

