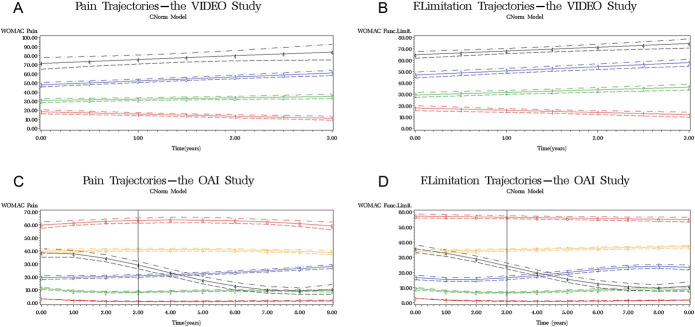
Figure 1.
Trajectories—red colour (-1-) indicates the first trajectory group, green (-2-) the second, blue (-3-) the third, black (-4-) the fourth, yellow (-5-) the fifth, and orange (-6-) the sixth group; (A) pain trajectories in the VIDEO trial; (B) functional limitation trajectories in the VIDEO trial; (C) pain trajectories in the OAI study with a window of 3-year follow-up comparable to the VIDEO trial duration; people with minimal-to-neglected knee pain—trajectory 1; low-fluctuating phenotype—trajectory 2 corresponding to the trajectory one in the VIDEO trial; mild-increasing phenotype—trajectory 3 corresponding to the trajectory 2 in the VIDEO trial; moderate-treatment-sensitive phenotype—trajectories 4 and 5 corresponding to the trajectory 3 in the VIDEO trial; high-treatment-insensitive phenotype corresponding to the trajectory 4 in the VIDEO trial; (D) functional limitation trajectories in the OAI study with a window of 3-year follow-up equivalent to the VIDEO trial duration. OAI = Osteoarthritis Initiative.

