
Figure 3.
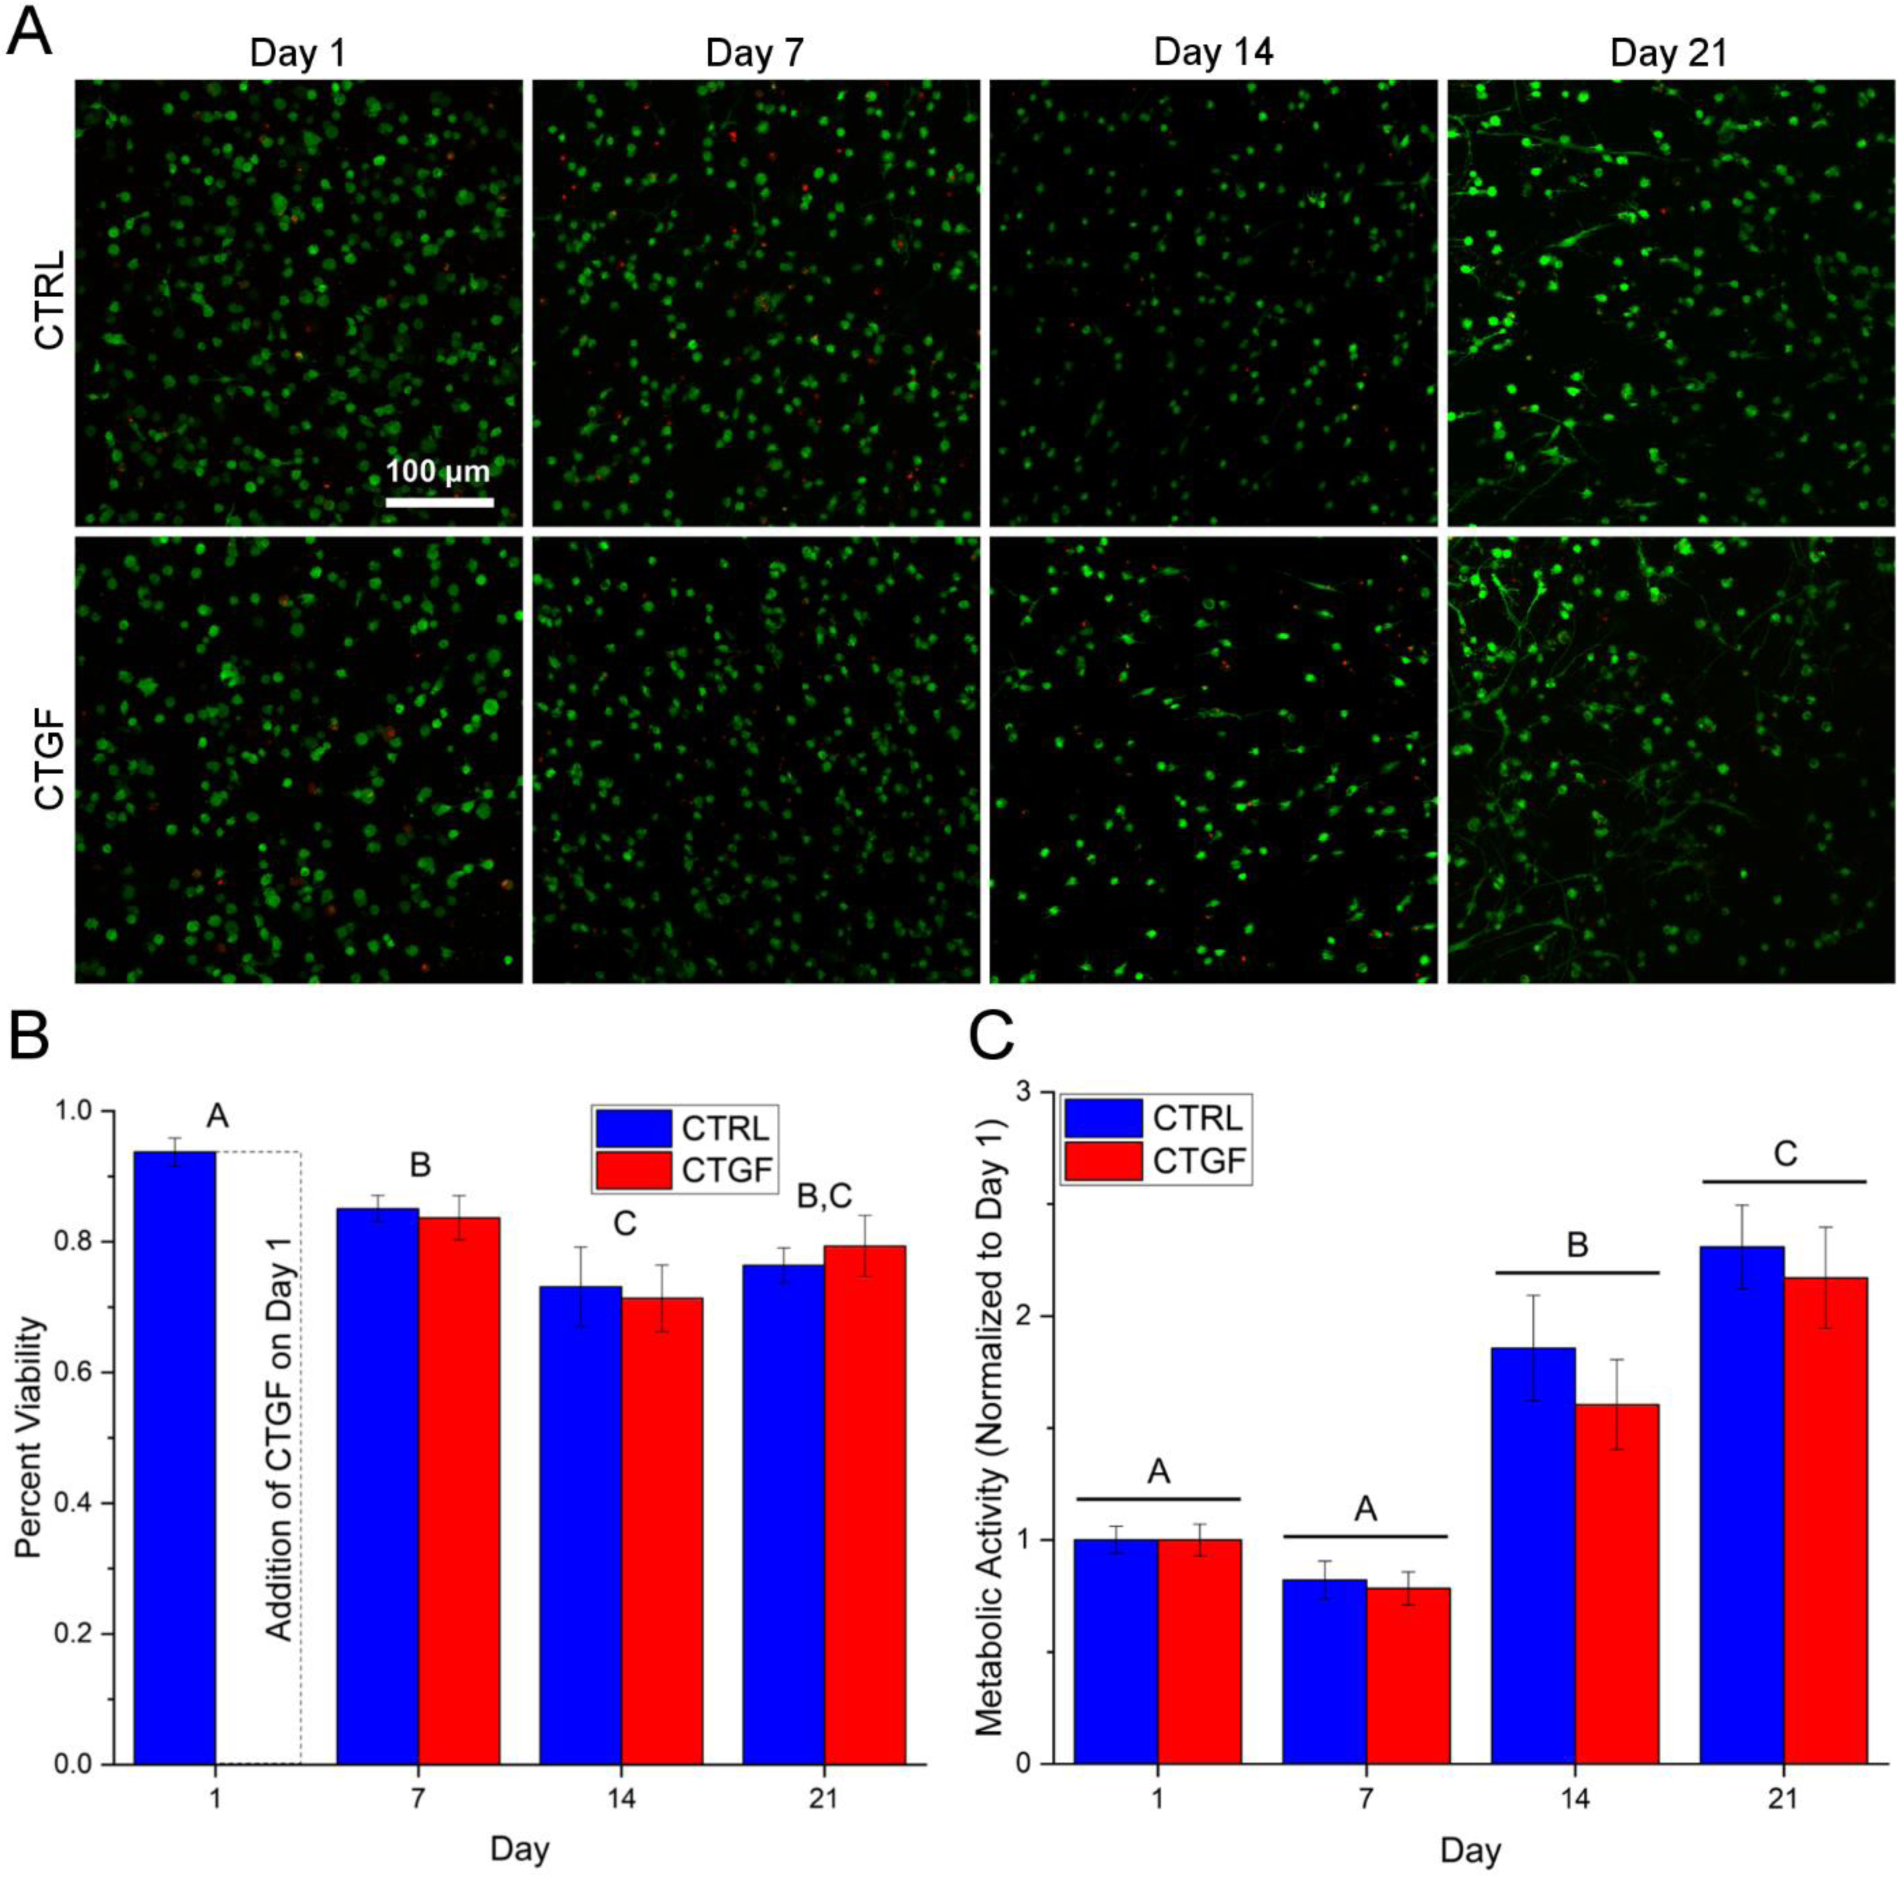
Viability (A-B) and metabolic activity (C) of hMSCs cultured in HA gels in fibrogenic (CTGF) or growth (CTRL) media. (A): Live and dead cells were stained by calcein AM (green) and ethidium homodimer (red), respectively. (B): Percent viability as quantified by the number of live cells over the total number of cells from the confocal images. (C): Metabolic activity as determined by PrestoBlue assay normalized to respective day 1 values. Groups not connected by the same letter are significantly different (p < 0.05).