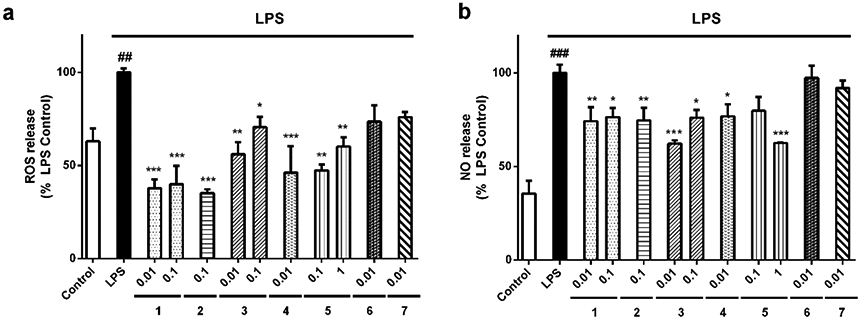
Figure 4.

Compounds decreased ROS and NO produced by microglia. BV2 cells were stimulated with 500 ng/mL LPS after pre-treatment with derivatives at μM concentrations for 1 h. After this time, the levels of (a) ROS and (b) NO were measured. Values are mean± SEM of three replicates performed by triplicate and expressed as percentage of LPS control cells. Statistical significance was determined with one way ANOVA test followed by Dunnett’s post-hoc test. LPS control cells are compared to inactivated microglia (##p<0.01, ###p<0.001). Treatments with compounds are compared to cells treated only with LPS (*p<0.05, **p<0.01, ***p<0.001).
