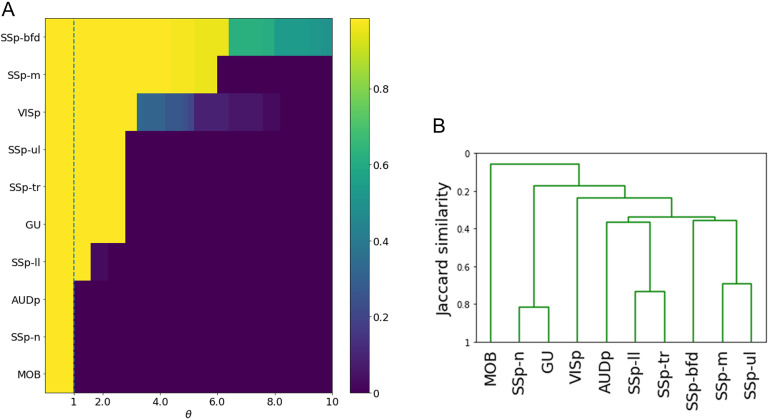
Figure 3. .
Effect of parameter θ on cascade size, and similarity between the 10 cascades. (A) Each row of the heat map shows the fraction of activated nodes after the stimulation of a single source, for different values of the threshold θ. The selected threshold is marked with the dashed vertical line. (B) Similarity between the 10 sensory cascades using the average-linkage hierarchical clustering method.

