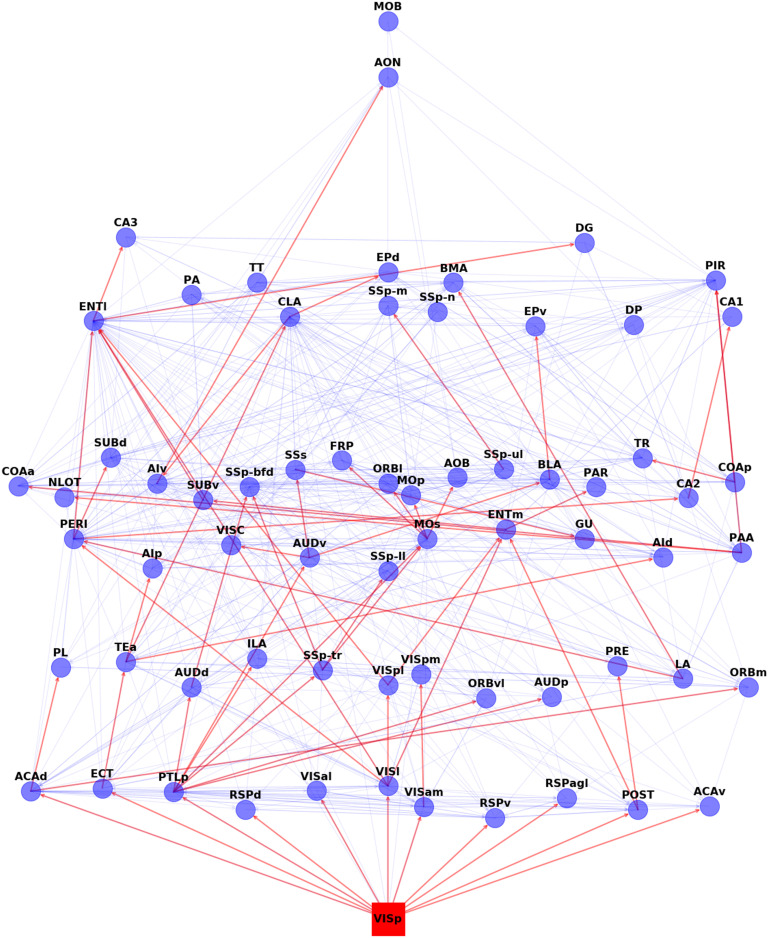
Figure 4. .
The visual activation cascade, according to ALT (θ = 0.98). The source for this cascade is the primary visual cortex (VISp). The red edges form the activation cascade, while the underlying blue edges show anatomical connections that do not participate in this cascade, those connections may be present in other sensory cascades or they may play a role in feedback (or second-order) interactions that are not captured by the “first ripple” scope of the ALT model. To help with the visualization, we place the nodes in eight layers, so that cascade edges only point from a layer to a higher layer (never to the same or lower layer). The vertical position of each node is slightly “jittered” to avoid cluttering due to anatomical connections between nodes of the same layer.

