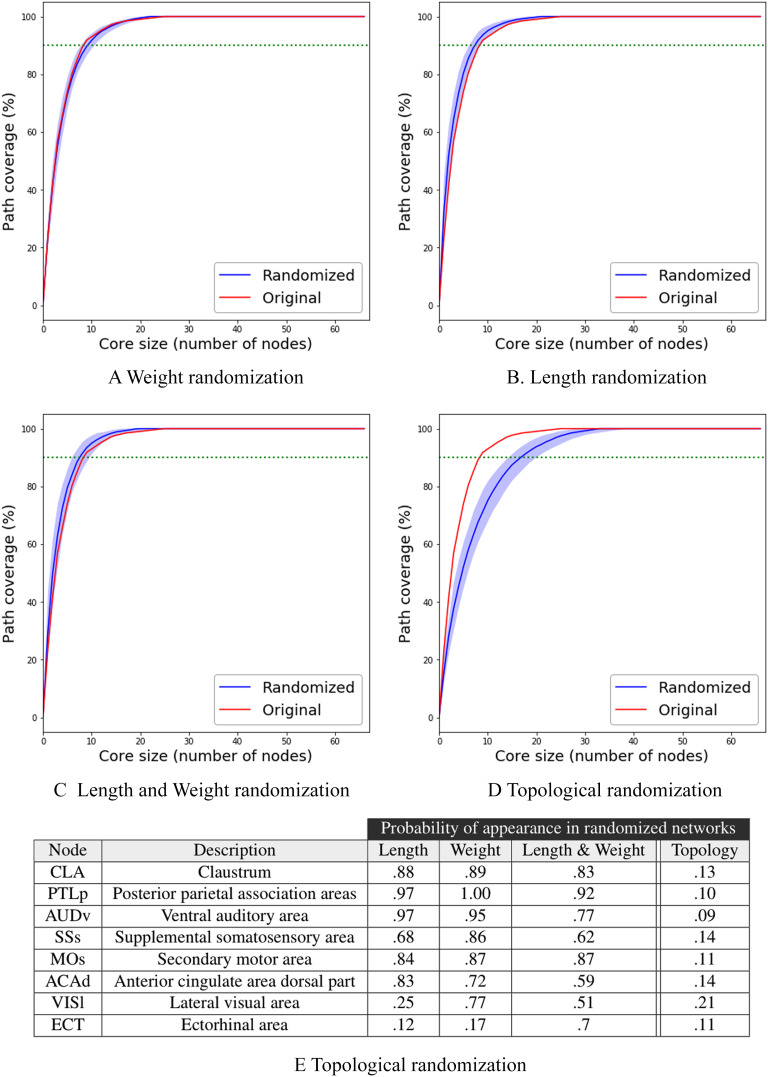
Figure 8. .
Robustness results. The effect of different connectome randomization methods on the core size. Light blue shade marks the 5% to 95% values among 100 randomization runs, while the solid blue line is the median of these runs. The red line represents the τ-core size for the original connectome. The dotted green line marks the τ-core size for τ = 90%. The table at the bottom shows the fraction of random networks that include each of the eight τ-core nodes.

