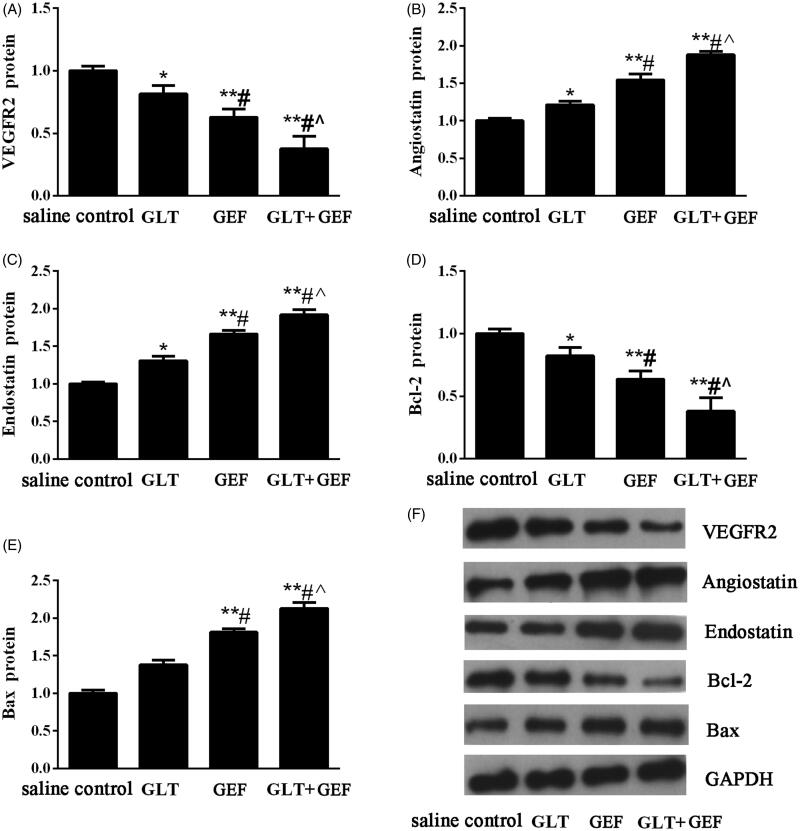
Figure 6.
The expression of VEGFR2, angiostatin, endostatin, Bcl-2 and Bax protein. (A) Relative protein expression levels of VEGFR2; (B) Relative protein expression levels of angiostatin; (C) Relative protein expression levels of endostatin; (D) Relative protein expression levels of Bcl-2; (E) Relative protein expression levels of Bax; (E) Representative western blotting images. *p < 0.05 vs. the saline control group; **p < 0.01 vs. the saline control group; #p < 0.05 vs. GLT group; ∧p < 0.05 vs. GEF group.

