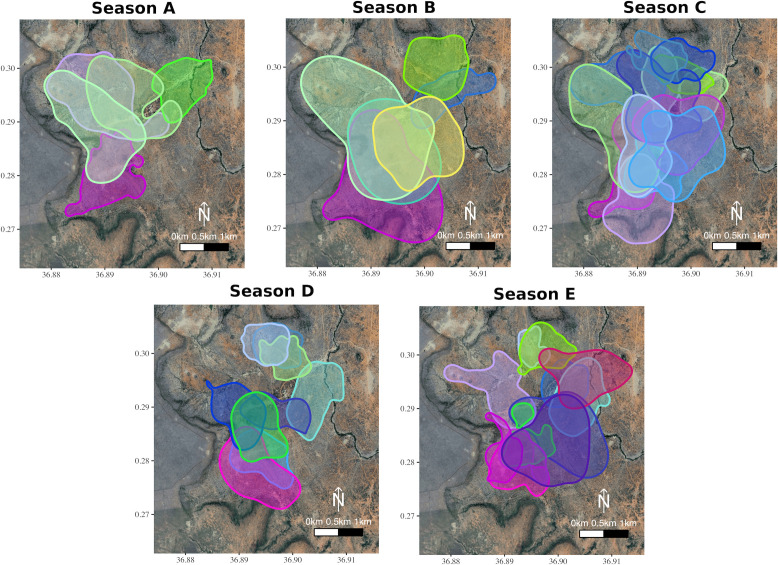
Figure 1. Group home-ranges in each of the study seasons.
The overlapping home-ranges (95% Auto-correlated Kernel Density Estimate; Fleming et al., 2015 of each the groups (up to 21 per season) across five different seasons calculated from the ctmms). Seasonal data were collected during periods of two months defined as being intermediate in terms of rainfall and greenness, as groups split to reproduce during twice-yearly breeding seasons and make exceptional movements to find water during droughts (see Materials and methods). These seasons were (A) 30.5.2017 to 1.8.2017, (B) 15.12.2017 to 15.2.2018, (C) 1.8.2018 to 29.9.2018, (D) 10.6.2019 to 9.8.2019, and (E) 14.1.2020 to 16.3.2020. Group membership was determined from daily census observations, and one GPS-tagged individual was selected at random from each group to define the group’s movement. Each distinct group is represented by a specific colour, and group colours are kept consistent across seasons.

