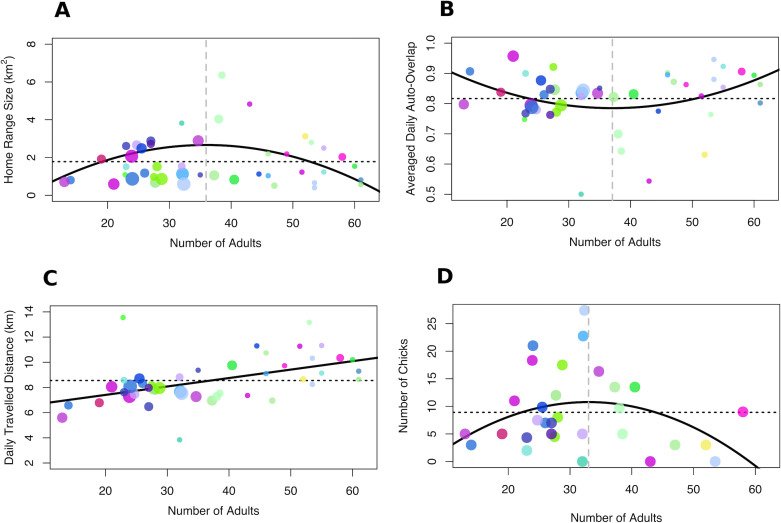
Figure 3. Relationship between group size, collective movement parameters and fitness.
(A) Home-range size and (B) average daily home-range overlap were maximised and minimised at intermediate group sizes, respectively. By contrast, (C) average daily distance travelled increased with group size. (D) Fitness, measured as the number of chicks per group in seasons when chicks were present in the population, was maximised for intermediate-sized groups. Each dot represents one group in one season and the colours for each group remain consistent with Figure 1. The size of the dots represents the number of chicks in the group for panels A–C. Solid black lines represent the fit of the data (in the absence of chicks for panels A–C), dashed black lines represent the mean across all group sizes and vertical dashed grey lines in A, B, and D represent the group size for which the curve of the response variable reaches a maximum (A and D) or a minimum (B).

