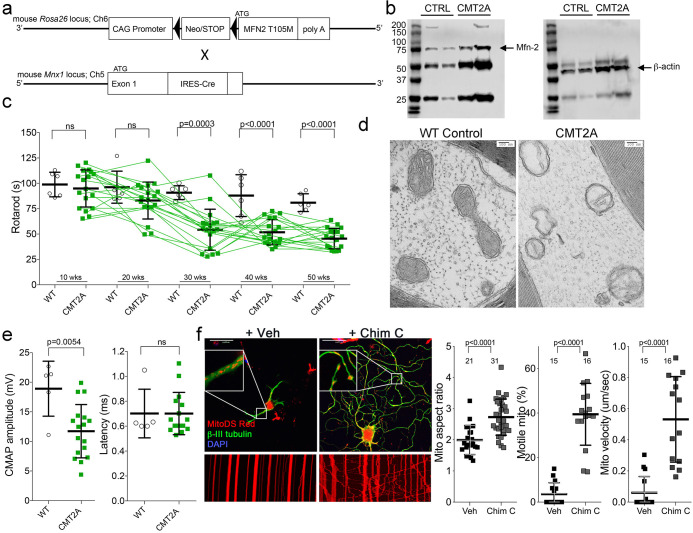
Figure 2. Characteristics of a neuron-specific MFN2 T105M mouse model of CMT2A.
(a) Schematic depiction Mfn2 <fs-T105M>expression strategy. (b) Immunoblot analysis of MFN2 expression in mouse sciatic nerves. (c) Serial RotaRod latency studies; CMT2A is green squares (n = 16), wild-type (WT) control is open circles (n = 6). (d) Electron micrographs of axonal mitochondrial from sciatic nerves (50 weeks). (e) Comparative neuro-electrophysiology study results of 50-week-old mice in panel c. (f) Response of CMT2A dorsal root ganglion neurons to mitofusin activation with Chimera C (100 nM, 48 hr). Top images are confocal micrographs of DRGs stained for mitochondria (red) and axons (green). Insets are higher power magnification to see mitochondrial morphology. Bottom images are kymographs showing mitochondrial (red) motility. Vertical columns are stationary mitochondria; lines transiting left to right or right to left are moving. P values are from t-test from 3 or four independent experiments.
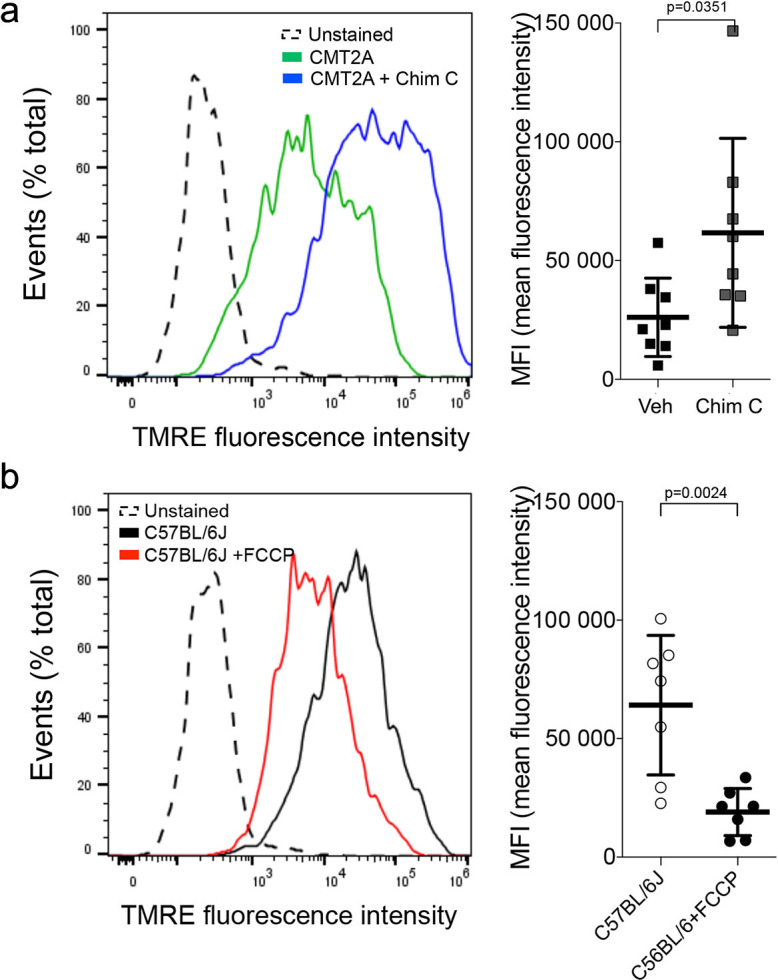
Figure 2—figure supplement 1. Flow cytometric profiling of mitochondrial polarization status in mouse dorsal root ganglion (DRG) neurons.


